Cypriot vs Immigrants from Egypt Householder Income Ages 45 - 64 years
COMPARE
Cypriot
Immigrants from Egypt
Householder Income Ages 45 - 64 years
Householder Income Ages 45 - 64 years Comparison
Cypriots
Immigrants from Egypt
$123,396
HOUSEHOLDER INCOME AGES 45 - 64 YEARS
100.0/ 100
METRIC RATING
11th/ 347
METRIC RANK
$109,941
HOUSEHOLDER INCOME AGES 45 - 64 YEARS
99.2/ 100
METRIC RATING
74th/ 347
METRIC RANK
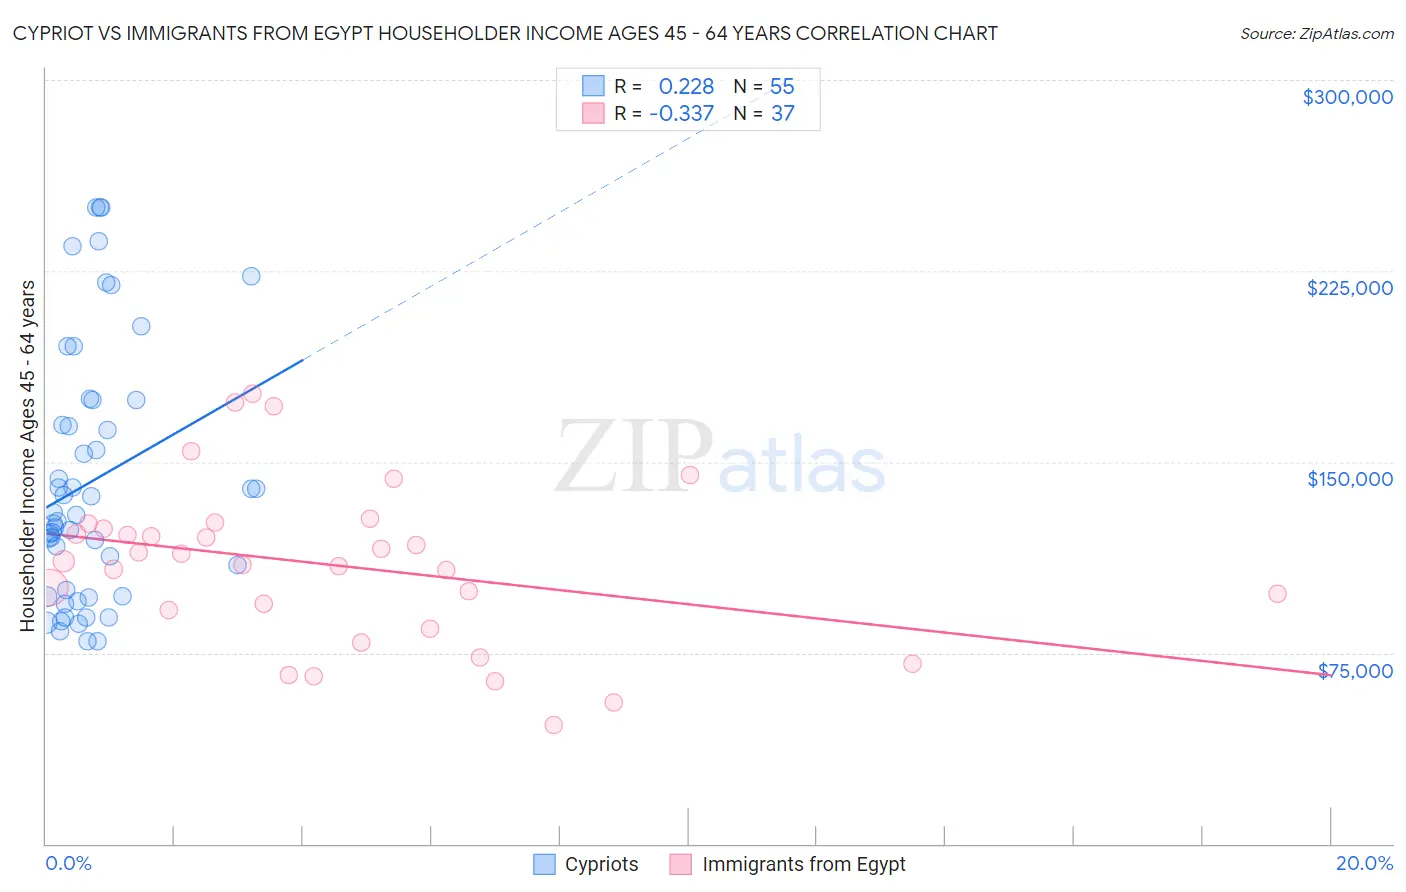
Cypriot vs Immigrants from Egypt Householder Income Ages 45 - 64 years Correlation Chart
The statistical analysis conducted on geographies consisting of 61,824,510 people shows a weak positive correlation between the proportion of Cypriots and household income with householder between the ages 45 and 64 in the United States with a correlation coefficient (R) of 0.228 and weighted average of $123,396. Similarly, the statistical analysis conducted on geographies consisting of 245,345,786 people shows a mild negative correlation between the proportion of Immigrants from Egypt and household income with householder between the ages 45 and 64 in the United States with a correlation coefficient (R) of -0.337 and weighted average of $109,941, a difference of 12.2%.
Householder Income Ages 45 - 64 years Correlation Summary
| Measurement | Cypriot | Immigrants from Egypt |
| Minimum | $79,338 | $46,773 |
| Maximum | $250,001 | $176,674 |
| Range | $170,663 | $129,901 |
| Mean | $142,303 | $109,415 |
| Median | $128,945 | $110,780 |
| Interquartile 25% (IQ1) | $97,356 | $88,195 |
| Interquartile 75% (IQ3) | $174,242 | $124,792 |
| Interquartile Range (IQR) | $76,886 | $36,597 |
| Standard Deviation (Sample) | $49,631 | $31,863 |
| Standard Deviation (Population) | $49,178 | $31,429 |
Similar Demographics by Householder Income Ages 45 - 64 years
Demographics Similar to Cypriots by Householder Income Ages 45 - 64 years
In terms of householder income ages 45 - 64 years, the demographic groups most similar to Cypriots are Immigrants from Israel ($122,893, a difference of 0.41%), Immigrants from Ireland ($122,757, a difference of 0.52%), Immigrants from South Central Asia ($124,188, a difference of 0.64%), Indian (Asian) ($122,343, a difference of 0.86%), and Immigrants from Eastern Asia ($122,222, a difference of 0.96%).
| Demographics | Rating | Rank | Householder Income Ages 45 - 64 years |
| Thais | 100.0 /100 | #4 | Exceptional $129,560 |
| Immigrants | Singapore | 100.0 /100 | #5 | Exceptional $129,514 |
| Iranians | 100.0 /100 | #6 | Exceptional $129,350 |
| Immigrants | Hong Kong | 100.0 /100 | #7 | Exceptional $127,500 |
| Immigrants | Iran | 100.0 /100 | #8 | Exceptional $126,940 |
| Okinawans | 100.0 /100 | #9 | Exceptional $124,796 |
| Immigrants | South Central Asia | 100.0 /100 | #10 | Exceptional $124,188 |
| Cypriots | 100.0 /100 | #11 | Exceptional $123,396 |
| Immigrants | Israel | 100.0 /100 | #12 | Exceptional $122,893 |
| Immigrants | Ireland | 100.0 /100 | #13 | Exceptional $122,757 |
| Indians (Asian) | 100.0 /100 | #14 | Exceptional $122,343 |
| Immigrants | Eastern Asia | 100.0 /100 | #15 | Exceptional $122,222 |
| Immigrants | China | 100.0 /100 | #16 | Exceptional $122,178 |
| Burmese | 100.0 /100 | #17 | Exceptional $121,444 |
| Immigrants | Korea | 100.0 /100 | #18 | Exceptional $121,243 |
Demographics Similar to Immigrants from Egypt by Householder Income Ages 45 - 64 years
In terms of householder income ages 45 - 64 years, the demographic groups most similar to Immigrants from Egypt are Argentinean ($110,103, a difference of 0.15%), South African ($109,719, a difference of 0.20%), Assyrian/Chaldean/Syriac ($110,201, a difference of 0.24%), Italian ($110,224, a difference of 0.26%), and Korean ($110,334, a difference of 0.36%).
| Demographics | Rating | Rank | Householder Income Ages 45 - 64 years |
| Laotians | 99.5 /100 | #67 | Exceptional $111,051 |
| Immigrants | Romania | 99.4 /100 | #68 | Exceptional $110,633 |
| Immigrants | Italy | 99.4 /100 | #69 | Exceptional $110,434 |
| Koreans | 99.3 /100 | #70 | Exceptional $110,334 |
| Italians | 99.3 /100 | #71 | Exceptional $110,224 |
| Assyrians/Chaldeans/Syriacs | 99.3 /100 | #72 | Exceptional $110,201 |
| Argentineans | 99.3 /100 | #73 | Exceptional $110,103 |
| Immigrants | Egypt | 99.2 /100 | #74 | Exceptional $109,941 |
| South Africans | 99.1 /100 | #75 | Exceptional $109,719 |
| Paraguayans | 99.0 /100 | #76 | Exceptional $109,447 |
| Immigrants | England | 99.0 /100 | #77 | Exceptional $109,446 |
| Immigrants | Canada | 99.0 /100 | #78 | Exceptional $109,402 |
| Immigrants | Bulgaria | 98.9 /100 | #79 | Exceptional $109,379 |
| Jordanians | 98.9 /100 | #80 | Exceptional $109,376 |
| Immigrants | Eastern Europe | 98.9 /100 | #81 | Exceptional $109,335 |