Cypriot vs Immigrants from South Central Asia Householder Income Ages 45 - 64 years
COMPARE
Cypriot
Immigrants from South Central Asia
Householder Income Ages 45 - 64 years
Householder Income Ages 45 - 64 years Comparison
Cypriots
Immigrants from South Central Asia
$123,396
HOUSEHOLDER INCOME AGES 45 - 64 YEARS
100.0/ 100
METRIC RATING
11th/ 347
METRIC RANK
$124,188
HOUSEHOLDER INCOME AGES 45 - 64 YEARS
100.0/ 100
METRIC RATING
10th/ 347
METRIC RANK
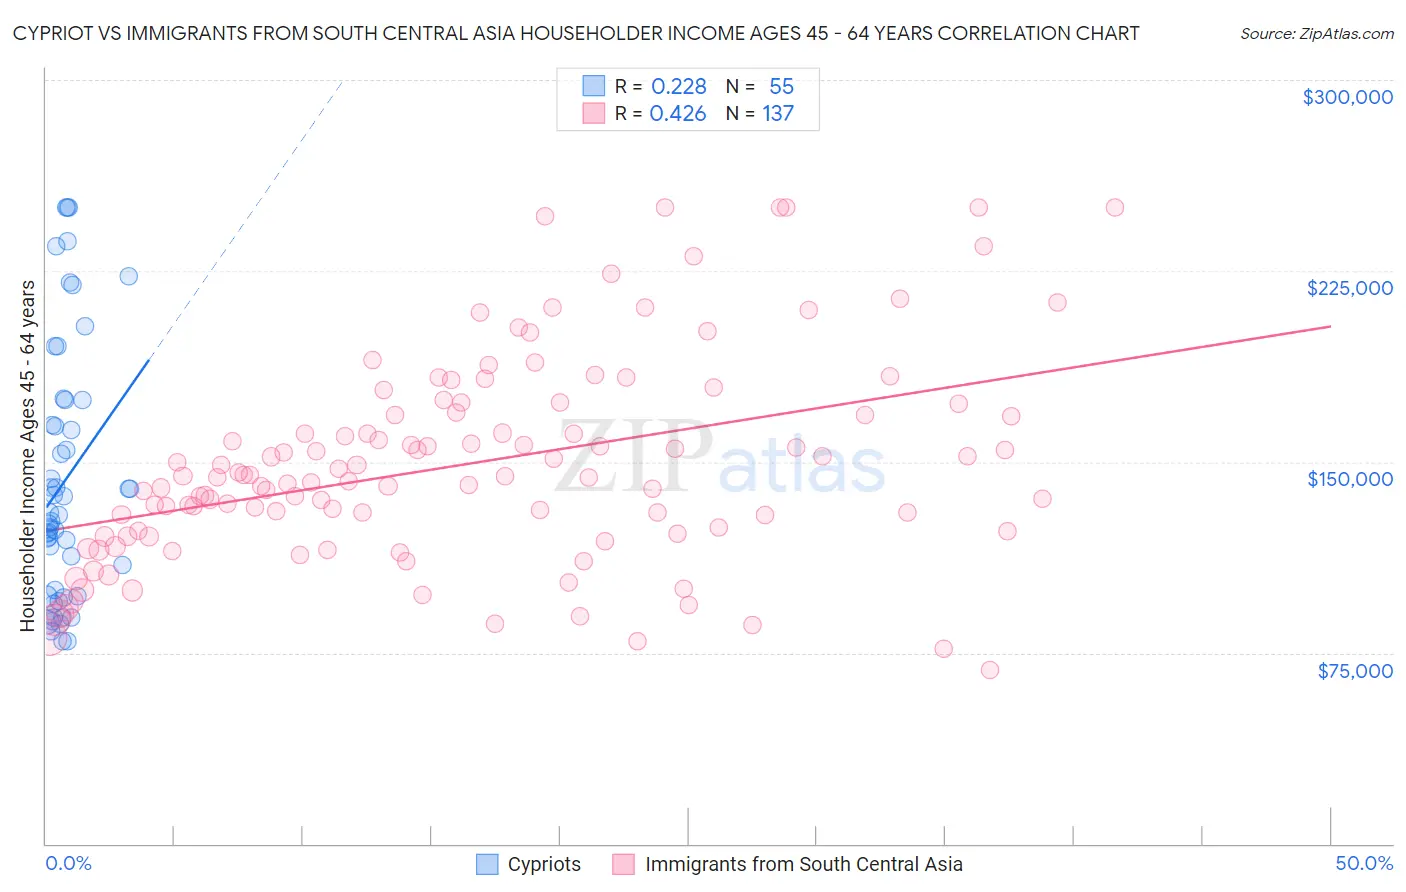
Cypriot vs Immigrants from South Central Asia Householder Income Ages 45 - 64 years Correlation Chart
The statistical analysis conducted on geographies consisting of 61,824,510 people shows a weak positive correlation between the proportion of Cypriots and household income with householder between the ages 45 and 64 in the United States with a correlation coefficient (R) of 0.228 and weighted average of $123,396. Similarly, the statistical analysis conducted on geographies consisting of 471,929,407 people shows a moderate positive correlation between the proportion of Immigrants from South Central Asia and household income with householder between the ages 45 and 64 in the United States with a correlation coefficient (R) of 0.426 and weighted average of $124,188, a difference of 0.64%.
Householder Income Ages 45 - 64 years Correlation Summary
| Measurement | Cypriot | Immigrants from South Central Asia |
| Minimum | $79,338 | $68,125 |
| Maximum | $250,001 | $250,001 |
| Range | $170,663 | $181,876 |
| Mean | $142,303 | $148,894 |
| Median | $128,945 | $144,037 |
| Interquartile 25% (IQ1) | $97,356 | $122,225 |
| Interquartile 75% (IQ3) | $174,242 | $168,955 |
| Interquartile Range (IQR) | $76,886 | $46,731 |
| Standard Deviation (Sample) | $49,631 | $40,252 |
| Standard Deviation (Population) | $49,178 | $40,105 |
Demographics Similar to Cypriots and Immigrants from South Central Asia by Householder Income Ages 45 - 64 years
In terms of householder income ages 45 - 64 years, the demographic groups most similar to Cypriots are Immigrants from Israel ($122,893, a difference of 0.41%), Immigrants from Ireland ($122,757, a difference of 0.52%), Indian (Asian) ($122,343, a difference of 0.86%), Immigrants from Eastern Asia ($122,222, a difference of 0.96%), and Immigrants from China ($122,178, a difference of 1.0%). Similarly, the demographic groups most similar to Immigrants from South Central Asia are Okinawan ($124,796, a difference of 0.49%), Immigrants from Israel ($122,893, a difference of 1.1%), Immigrants from Ireland ($122,757, a difference of 1.2%), Indian (Asian) ($122,343, a difference of 1.5%), and Immigrants from Eastern Asia ($122,222, a difference of 1.6%).
| Demographics | Rating | Rank | Householder Income Ages 45 - 64 years |
| Immigrants | Taiwan | 100.0 /100 | #1 | Exceptional $135,508 |
| Filipinos | 100.0 /100 | #2 | Exceptional $134,910 |
| Immigrants | India | 100.0 /100 | #3 | Exceptional $132,488 |
| Thais | 100.0 /100 | #4 | Exceptional $129,560 |
| Immigrants | Singapore | 100.0 /100 | #5 | Exceptional $129,514 |
| Iranians | 100.0 /100 | #6 | Exceptional $129,350 |
| Immigrants | Hong Kong | 100.0 /100 | #7 | Exceptional $127,500 |
| Immigrants | Iran | 100.0 /100 | #8 | Exceptional $126,940 |
| Okinawans | 100.0 /100 | #9 | Exceptional $124,796 |
| Immigrants | South Central Asia | 100.0 /100 | #10 | Exceptional $124,188 |
| Cypriots | 100.0 /100 | #11 | Exceptional $123,396 |
| Immigrants | Israel | 100.0 /100 | #12 | Exceptional $122,893 |
| Immigrants | Ireland | 100.0 /100 | #13 | Exceptional $122,757 |
| Indians (Asian) | 100.0 /100 | #14 | Exceptional $122,343 |
| Immigrants | Eastern Asia | 100.0 /100 | #15 | Exceptional $122,222 |
| Immigrants | China | 100.0 /100 | #16 | Exceptional $122,178 |
| Burmese | 100.0 /100 | #17 | Exceptional $121,444 |
| Immigrants | Korea | 100.0 /100 | #18 | Exceptional $121,243 |
| Eastern Europeans | 100.0 /100 | #19 | Exceptional $120,684 |
| Immigrants | Australia | 100.0 /100 | #20 | Exceptional $119,308 |