Soviet Union vs Somali Householder Income Ages 45 - 64 years
COMPARE
Soviet Union
Somali
Householder Income Ages 45 - 64 years
Householder Income Ages 45 - 64 years Comparison
Soviet Union
Somalis
$112,008
HOUSEHOLDER INCOME AGES 45 - 64 YEARS
99.7/ 100
METRIC RATING
58th/ 347
METRIC RANK
$88,600
HOUSEHOLDER INCOME AGES 45 - 64 YEARS
0.3/ 100
METRIC RATING
262nd/ 347
METRIC RANK
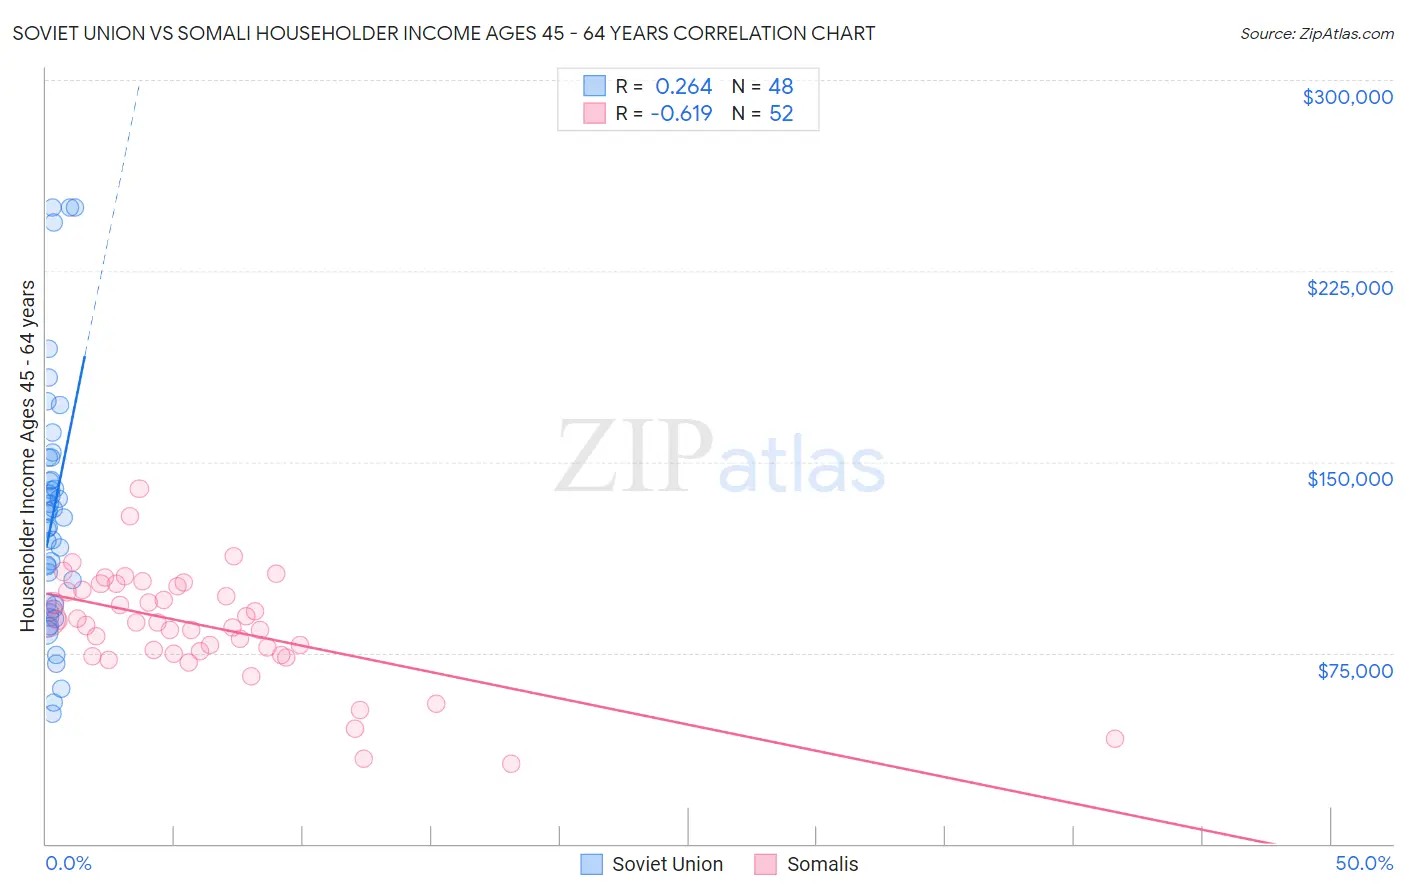
Soviet Union vs Somali Householder Income Ages 45 - 64 years Correlation Chart
The statistical analysis conducted on geographies consisting of 43,509,359 people shows a weak positive correlation between the proportion of Soviet Union and household income with householder between the ages 45 and 64 in the United States with a correlation coefficient (R) of 0.264 and weighted average of $112,008. Similarly, the statistical analysis conducted on geographies consisting of 99,239,152 people shows a significant negative correlation between the proportion of Somalis and household income with householder between the ages 45 and 64 in the United States with a correlation coefficient (R) of -0.619 and weighted average of $88,600, a difference of 26.4%.
Householder Income Ages 45 - 64 years Correlation Summary
| Measurement | Soviet Union | Somali |
| Minimum | $51,149 | $31,458 |
| Maximum | $250,001 | $139,513 |
| Range | $198,852 | $108,055 |
| Mean | $129,545 | $85,624 |
| Median | $126,259 | $86,901 |
| Interquartile 25% (IQ1) | $92,904 | $75,206 |
| Interquartile 75% (IQ3) | $147,283 | $100,414 |
| Interquartile Range (IQR) | $54,378 | $25,208 |
| Standard Deviation (Sample) | $48,678 | $21,267 |
| Standard Deviation (Population) | $48,168 | $21,061 |
Similar Demographics by Householder Income Ages 45 - 64 years
Demographics Similar to Soviet Union by Householder Income Ages 45 - 64 years
In terms of householder income ages 45 - 64 years, the demographic groups most similar to Soviet Union are Immigrants from Europe ($111,984, a difference of 0.020%), Immigrants from Netherlands ($111,982, a difference of 0.020%), Immigrants from Czechoslovakia ($111,914, a difference of 0.080%), Immigrants from Scotland ($112,175, a difference of 0.15%), and Egyptian ($112,256, a difference of 0.22%).
| Demographics | Rating | Rank | Householder Income Ages 45 - 64 years |
| Immigrants | South Africa | 99.8 /100 | #51 | Exceptional $112,886 |
| Immigrants | Malaysia | 99.8 /100 | #52 | Exceptional $112,796 |
| Afghans | 99.8 /100 | #53 | Exceptional $112,676 |
| Greeks | 99.8 /100 | #54 | Exceptional $112,630 |
| Lithuanians | 99.8 /100 | #55 | Exceptional $112,484 |
| Egyptians | 99.7 /100 | #56 | Exceptional $112,256 |
| Immigrants | Scotland | 99.7 /100 | #57 | Exceptional $112,175 |
| Soviet Union | 99.7 /100 | #58 | Exceptional $112,008 |
| Immigrants | Europe | 99.7 /100 | #59 | Exceptional $111,984 |
| Immigrants | Netherlands | 99.7 /100 | #60 | Exceptional $111,982 |
| Immigrants | Czechoslovakia | 99.7 /100 | #61 | Exceptional $111,914 |
| Immigrants | Norway | 99.7 /100 | #62 | Exceptional $111,669 |
| Mongolians | 99.6 /100 | #63 | Exceptional $111,602 |
| Immigrants | Latvia | 99.6 /100 | #64 | Exceptional $111,454 |
| Immigrants | Belarus | 99.6 /100 | #65 | Exceptional $111,430 |
Demographics Similar to Somalis by Householder Income Ages 45 - 64 years
In terms of householder income ages 45 - 64 years, the demographic groups most similar to Somalis are Belizean ($88,684, a difference of 0.090%), Immigrants from Senegal ($88,421, a difference of 0.20%), Osage ($88,390, a difference of 0.24%), Jamaican ($88,327, a difference of 0.31%), and Liberian ($88,929, a difference of 0.37%).
| Demographics | Rating | Rank | Householder Income Ages 45 - 64 years |
| West Indians | 0.5 /100 | #255 | Tragic $89,906 |
| French American Indians | 0.5 /100 | #256 | Tragic $89,811 |
| German Russians | 0.4 /100 | #257 | Tragic $89,398 |
| Immigrants | Barbados | 0.4 /100 | #258 | Tragic $89,394 |
| Immigrants | Nicaragua | 0.4 /100 | #259 | Tragic $89,108 |
| Liberians | 0.3 /100 | #260 | Tragic $88,929 |
| Belizeans | 0.3 /100 | #261 | Tragic $88,684 |
| Somalis | 0.3 /100 | #262 | Tragic $88,600 |
| Immigrants | Senegal | 0.3 /100 | #263 | Tragic $88,421 |
| Osage | 0.3 /100 | #264 | Tragic $88,390 |
| Jamaicans | 0.2 /100 | #265 | Tragic $88,327 |
| Immigrants | West Indies | 0.2 /100 | #266 | Tragic $88,164 |
| Hmong | 0.2 /100 | #267 | Tragic $88,115 |
| Immigrants | Micronesia | 0.2 /100 | #268 | Tragic $87,864 |
| Spanish Americans | 0.2 /100 | #269 | Tragic $87,836 |