Cypriot vs Immigrants from Cambodia Median Earnings
COMPARE
Cypriot
Immigrants from Cambodia
Median Earnings
Median Earnings Comparison
Cypriots
Immigrants from Cambodia
$54,589
MEDIAN EARNINGS
100.0/ 100
METRIC RATING
20th/ 347
METRIC RANK
$45,090
MEDIAN EARNINGS
13.2/ 100
METRIC RATING
225th/ 347
METRIC RANK
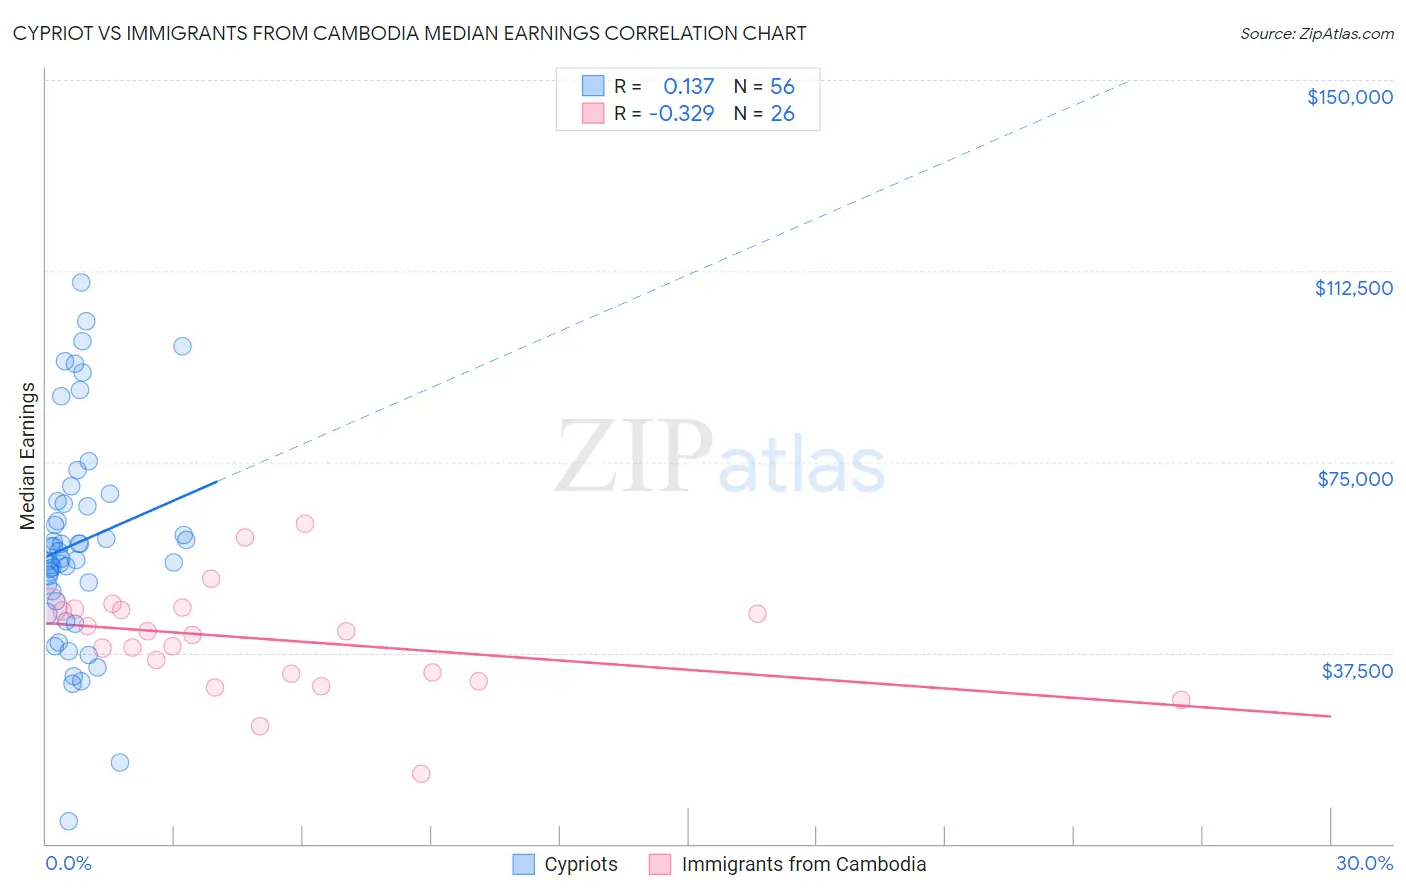
Cypriot vs Immigrants from Cambodia Median Earnings Correlation Chart
The statistical analysis conducted on geographies consisting of 61,853,771 people shows a poor positive correlation between the proportion of Cypriots and median earnings in the United States with a correlation coefficient (R) of 0.137 and weighted average of $54,589. Similarly, the statistical analysis conducted on geographies consisting of 205,155,765 people shows a mild negative correlation between the proportion of Immigrants from Cambodia and median earnings in the United States with a correlation coefficient (R) of -0.329 and weighted average of $45,090, a difference of 21.1%.
Median Earnings Correlation Summary
| Measurement | Cypriot | Immigrants from Cambodia |
| Minimum | $4,333 | $13,852 |
| Maximum | $110,295 | $62,969 |
| Range | $105,962 | $49,117 |
| Mean | $59,088 | $40,126 |
| Median | $56,710 | $41,377 |
| Interquartile 25% (IQ1) | $48,668 | $33,437 |
| Interquartile 75% (IQ3) | $66,958 | $46,102 |
| Interquartile Range (IQR) | $18,291 | $12,665 |
| Standard Deviation (Sample) | $21,103 | $10,590 |
| Standard Deviation (Population) | $20,914 | $10,384 |
Similar Demographics by Median Earnings
Demographics Similar to Cypriots by Median Earnings
In terms of median earnings, the demographic groups most similar to Cypriots are Burmese ($54,559, a difference of 0.060%), Immigrants from Korea ($54,530, a difference of 0.11%), Immigrants from Belgium ($54,679, a difference of 0.16%), Immigrants from Sweden ($54,478, a difference of 0.20%), and Soviet Union ($54,290, a difference of 0.55%).
| Demographics | Rating | Rank | Median Earnings |
| Immigrants | China | 100.0 /100 | #13 | Exceptional $56,638 |
| Immigrants | Australia | 100.0 /100 | #14 | Exceptional $56,305 |
| Indians (Asian) | 100.0 /100 | #15 | Exceptional $56,253 |
| Immigrants | Eastern Asia | 100.0 /100 | #16 | Exceptional $56,183 |
| Eastern Europeans | 100.0 /100 | #17 | Exceptional $55,084 |
| Immigrants | Japan | 100.0 /100 | #18 | Exceptional $54,938 |
| Immigrants | Belgium | 100.0 /100 | #19 | Exceptional $54,679 |
| Cypriots | 100.0 /100 | #20 | Exceptional $54,589 |
| Burmese | 100.0 /100 | #21 | Exceptional $54,559 |
| Immigrants | Korea | 100.0 /100 | #22 | Exceptional $54,530 |
| Immigrants | Sweden | 100.0 /100 | #23 | Exceptional $54,478 |
| Soviet Union | 100.0 /100 | #24 | Exceptional $54,290 |
| Turks | 100.0 /100 | #25 | Exceptional $53,919 |
| Immigrants | Northern Europe | 100.0 /100 | #26 | Exceptional $53,872 |
| Asians | 100.0 /100 | #27 | Exceptional $53,690 |
Demographics Similar to Immigrants from Cambodia by Median Earnings
In terms of median earnings, the demographic groups most similar to Immigrants from Cambodia are West Indian ($45,132, a difference of 0.090%), Immigrants from Nigeria ($45,030, a difference of 0.13%), Native Hawaiian ($45,027, a difference of 0.14%), Immigrants from Iraq ($44,988, a difference of 0.22%), and Immigrants from Panama ($45,198, a difference of 0.24%).
| Demographics | Rating | Rank | Median Earnings |
| Spanish | 19.7 /100 | #218 | Poor $45,432 |
| Dutch | 18.4 /100 | #219 | Poor $45,370 |
| Ecuadorians | 15.3 /100 | #220 | Poor $45,214 |
| Immigrants | Guyana | 15.1 /100 | #221 | Poor $45,204 |
| Immigrants | Panama | 15.0 /100 | #222 | Poor $45,198 |
| Whites/Caucasians | 15.0 /100 | #223 | Poor $45,197 |
| West Indians | 13.9 /100 | #224 | Poor $45,132 |
| Immigrants | Cambodia | 13.2 /100 | #225 | Poor $45,090 |
| Immigrants | Nigeria | 12.2 /100 | #226 | Poor $45,030 |
| Native Hawaiians | 12.2 /100 | #227 | Poor $45,027 |
| Immigrants | Iraq | 11.6 /100 | #228 | Poor $44,988 |
| Scotch-Irish | 10.7 /100 | #229 | Poor $44,924 |
| Immigrants | Western Africa | 10.3 /100 | #230 | Poor $44,893 |
| Japanese | 9.5 /100 | #231 | Tragic $44,825 |
| Delaware | 9.0 /100 | #232 | Tragic $44,783 |