Cypriot vs Immigrants from Middle Africa Seniors Poverty Over the Age of 75
COMPARE
Cypriot
Immigrants from Middle Africa
Seniors Poverty Over the Age of 75
Seniors Poverty Over the Age of 75 Comparison
Cypriots
Immigrants from Middle Africa
12.0%
SENIORS POVERTY OVER THE AGE OF 75
67.3/ 100
METRIC RATING
150th/ 347
METRIC RANK
12.1%
SENIORS POVERTY OVER THE AGE OF 75
61.2/ 100
METRIC RATING
159th/ 347
METRIC RANK
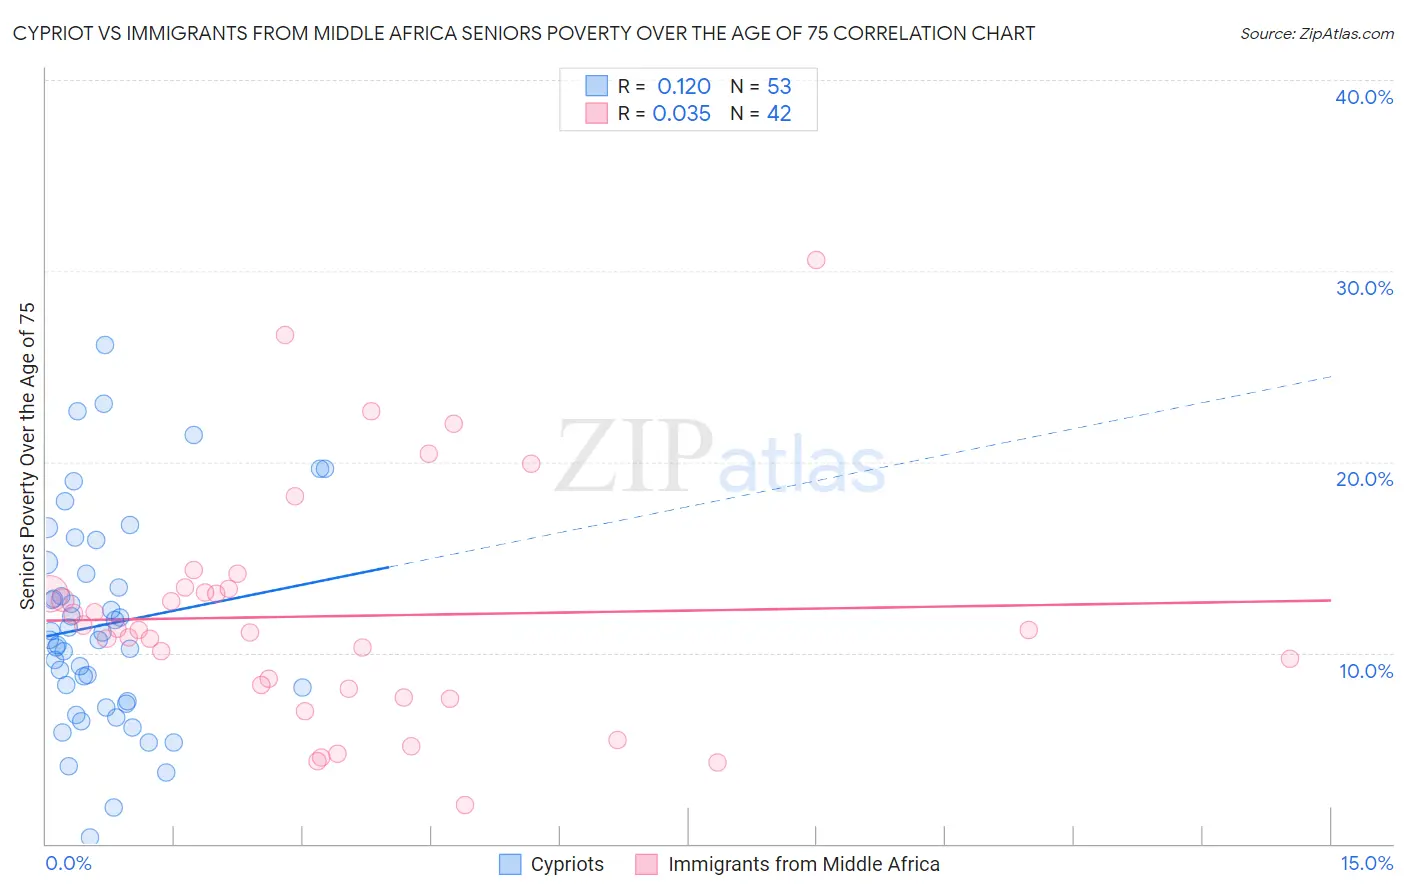
Cypriot vs Immigrants from Middle Africa Seniors Poverty Over the Age of 75 Correlation Chart
The statistical analysis conducted on geographies consisting of 61,675,074 people shows a poor positive correlation between the proportion of Cypriots and poverty level among seniors over the age of 75 in the United States with a correlation coefficient (R) of 0.120 and weighted average of 12.0%. Similarly, the statistical analysis conducted on geographies consisting of 201,532,689 people shows no correlation between the proportion of Immigrants from Middle Africa and poverty level among seniors over the age of 75 in the United States with a correlation coefficient (R) of 0.035 and weighted average of 12.1%, a difference of 0.55%.
Seniors Poverty Over the Age of 75 Correlation Summary
| Measurement | Cypriot | Immigrants from Middle Africa |
| Minimum | 0.34% | 2.1% |
| Maximum | 26.1% | 30.6% |
| Range | 25.8% | 28.5% |
| Mean | 11.5% | 11.9% |
| Median | 10.7% | 11.2% |
| Interquartile 25% (IQ1) | 7.4% | 8.1% |
| Interquartile 75% (IQ3) | 14.4% | 13.4% |
| Interquartile Range (IQR) | 7.0% | 5.2% |
| Standard Deviation (Sample) | 5.5% | 6.1% |
| Standard Deviation (Population) | 5.4% | 6.0% |
Demographics Similar to Cypriots and Immigrants from Middle Africa by Seniors Poverty Over the Age of 75
In terms of seniors poverty over the age of 75, the demographic groups most similar to Cypriots are Asian (12.0%, a difference of 0.010%), Immigrants from Zaire (12.0%, a difference of 0.030%), Cherokee (12.0%, a difference of 0.14%), Immigrants from Latvia (12.0%, a difference of 0.17%), and Immigrants from Korea (12.0%, a difference of 0.17%). Similarly, the demographic groups most similar to Immigrants from Middle Africa are Portuguese (12.1%, a difference of 0.010%), Immigrants from Eastern Africa (12.1%, a difference of 0.030%), Immigrants from Sudan (12.1%, a difference of 0.040%), Immigrants from Norway (12.1%, a difference of 0.050%), and Immigrants from Serbia (12.1%, a difference of 0.080%).
| Demographics | Rating | Rank | Seniors Poverty Over the Age of 75 |
| Hmong | 70.8 /100 | #144 | Good 12.0% |
| Immigrants | Belgium | 70.8 /100 | #145 | Good 12.0% |
| Bangladeshis | 70.4 /100 | #146 | Good 12.0% |
| Immigrants | Latvia | 69.1 /100 | #147 | Good 12.0% |
| Immigrants | Zaire | 67.6 /100 | #148 | Good 12.0% |
| Asians | 67.4 /100 | #149 | Good 12.0% |
| Cypriots | 67.3 /100 | #150 | Good 12.0% |
| Cherokee | 65.8 /100 | #151 | Good 12.0% |
| Immigrants | Korea | 65.5 /100 | #152 | Good 12.0% |
| Immigrants | Turkey | 64.7 /100 | #153 | Good 12.0% |
| Cambodians | 64.0 /100 | #154 | Good 12.0% |
| Indonesians | 62.6 /100 | #155 | Good 12.1% |
| Immigrants | Burma/Myanmar | 62.3 /100 | #156 | Good 12.1% |
| Immigrants | Sudan | 61.7 /100 | #157 | Good 12.1% |
| Portuguese | 61.3 /100 | #158 | Good 12.1% |
| Immigrants | Middle Africa | 61.2 /100 | #159 | Good 12.1% |
| Immigrants | Eastern Africa | 60.9 /100 | #160 | Good 12.1% |
| Immigrants | Norway | 60.6 /100 | #161 | Good 12.1% |
| Immigrants | Serbia | 60.2 /100 | #162 | Good 12.1% |
| Immigrants | Greece | 58.2 /100 | #163 | Average 12.1% |
| Potawatomi | 57.4 /100 | #164 | Average 12.1% |