Cuban vs Kenyan Householder Income Over 65 years
COMPARE
Cuban
Kenyan
Householder Income Over 65 years
Householder Income Over 65 years Comparison
Cubans
Kenyans
$49,152
HOUSEHOLDER INCOME OVER 65 YEARS
0.0/ 100
METRIC RATING
336th/ 347
METRIC RANK
$60,514
HOUSEHOLDER INCOME OVER 65 YEARS
38.4/ 100
METRIC RATING
183rd/ 347
METRIC RANK
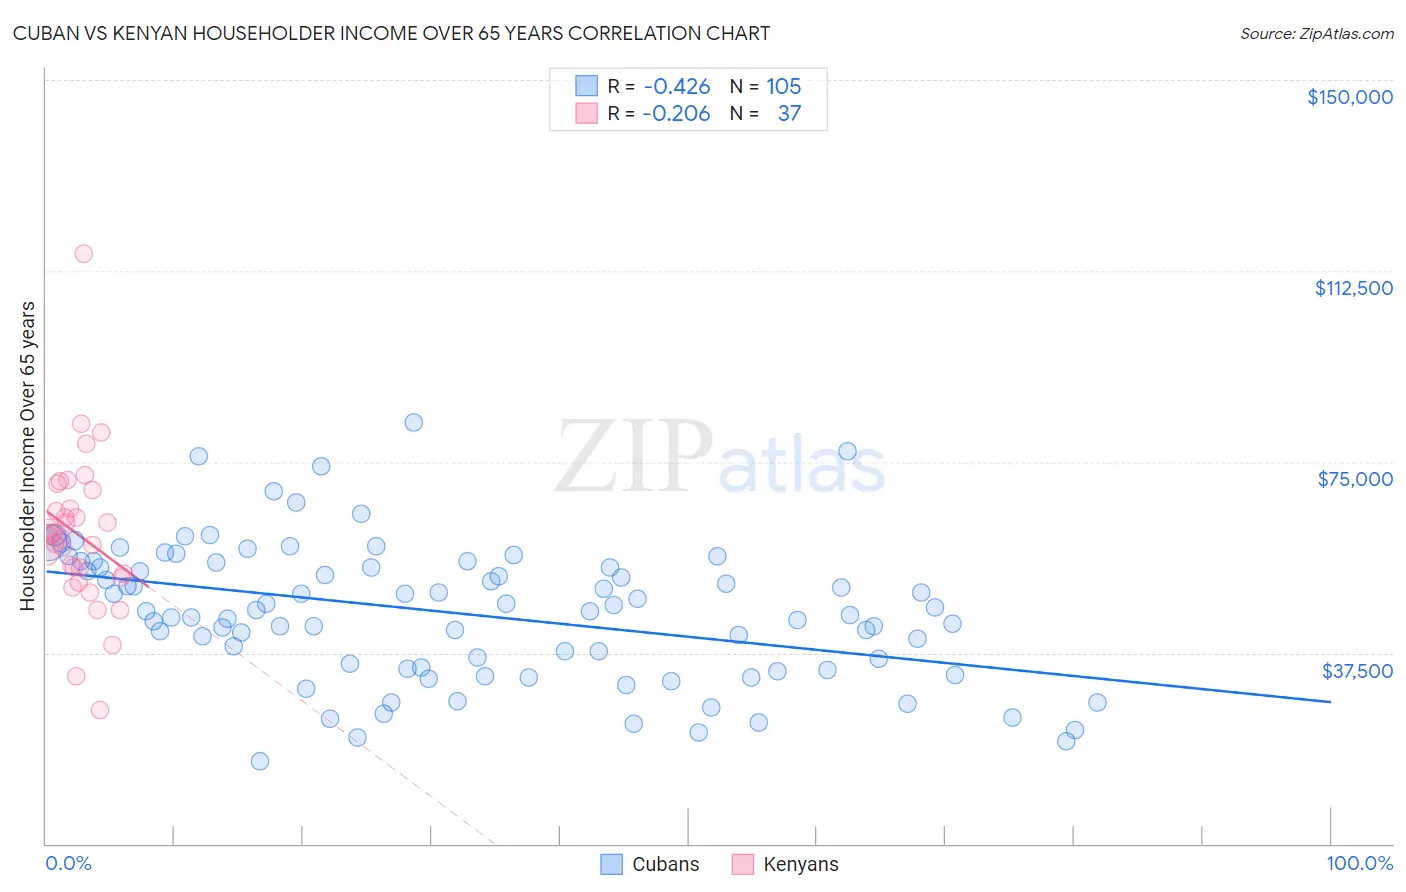
Cuban vs Kenyan Householder Income Over 65 years Correlation Chart
The statistical analysis conducted on geographies consisting of 447,397,071 people shows a moderate negative correlation between the proportion of Cubans and household income with householder over the age of 65 in the United States with a correlation coefficient (R) of -0.426 and weighted average of $49,152. Similarly, the statistical analysis conducted on geographies consisting of 167,861,948 people shows a weak negative correlation between the proportion of Kenyans and household income with householder over the age of 65 in the United States with a correlation coefficient (R) of -0.206 and weighted average of $60,514, a difference of 23.1%.
Householder Income Over 65 years Correlation Summary
| Measurement | Cuban | Kenyan |
| Minimum | $16,239 | $26,155 |
| Maximum | $82,682 | $115,950 |
| Range | $66,443 | $89,795 |
| Mean | $45,309 | $60,697 |
| Median | $45,658 | $60,482 |
| Interquartile 25% (IQ1) | $34,482 | $52,723 |
| Interquartile 75% (IQ3) | $54,771 | $67,615 |
| Interquartile Range (IQR) | $20,289 | $14,892 |
| Standard Deviation (Sample) | $13,460 | $15,220 |
| Standard Deviation (Population) | $13,396 | $15,013 |
Similar Demographics by Householder Income Over 65 years
Demographics Similar to Cubans by Householder Income Over 65 years
In terms of householder income over 65 years, the demographic groups most similar to Cubans are Tohono O'odham ($49,121, a difference of 0.060%), Crow ($49,234, a difference of 0.17%), Immigrants from Caribbean ($48,535, a difference of 1.3%), Immigrants from Dominica ($50,071, a difference of 1.9%), and Cape Verdean ($50,077, a difference of 1.9%).
| Demographics | Rating | Rank | Householder Income Over 65 years |
| Blacks/African Americans | 0.0 /100 | #329 | Tragic $50,779 |
| Immigrants | Grenada | 0.0 /100 | #330 | Tragic $50,747 |
| Pima | 0.0 /100 | #331 | Tragic $50,539 |
| Dutch West Indians | 0.0 /100 | #332 | Tragic $50,475 |
| Cape Verdeans | 0.0 /100 | #333 | Tragic $50,077 |
| Immigrants | Dominica | 0.0 /100 | #334 | Tragic $50,071 |
| Crow | 0.0 /100 | #335 | Tragic $49,234 |
| Cubans | 0.0 /100 | #336 | Tragic $49,152 |
| Tohono O'odham | 0.0 /100 | #337 | Tragic $49,121 |
| Immigrants | Caribbean | 0.0 /100 | #338 | Tragic $48,535 |
| Navajo | 0.0 /100 | #339 | Tragic $47,722 |
| Immigrants | Yemen | 0.0 /100 | #340 | Tragic $47,527 |
| Dominicans | 0.0 /100 | #341 | Tragic $46,964 |
| Immigrants | Cabo Verde | 0.0 /100 | #342 | Tragic $46,654 |
| Immigrants | Dominican Republic | 0.0 /100 | #343 | Tragic $45,758 |
Demographics Similar to Kenyans by Householder Income Over 65 years
In terms of householder income over 65 years, the demographic groups most similar to Kenyans are Iraqi ($60,466, a difference of 0.080%), Czechoslovakian ($60,581, a difference of 0.11%), Celtic ($60,608, a difference of 0.15%), Immigrants from Morocco ($60,647, a difference of 0.22%), and Welsh ($60,666, a difference of 0.25%).
| Demographics | Rating | Rank | Householder Income Over 65 years |
| Spanish | 45.5 /100 | #176 | Average $60,795 |
| Alaska Natives | 44.3 /100 | #177 | Average $60,748 |
| Yup'ik | 43.7 /100 | #178 | Average $60,727 |
| Welsh | 42.2 /100 | #179 | Average $60,666 |
| Immigrants | Morocco | 41.7 /100 | #180 | Average $60,647 |
| Celtics | 40.7 /100 | #181 | Average $60,608 |
| Czechoslovakians | 40.0 /100 | #182 | Average $60,581 |
| Kenyans | 38.4 /100 | #183 | Fair $60,514 |
| Iraqis | 37.2 /100 | #184 | Fair $60,466 |
| Albanians | 32.0 /100 | #185 | Fair $60,249 |
| Slovenes | 31.8 /100 | #186 | Fair $60,241 |
| Immigrants | Thailand | 31.3 /100 | #187 | Fair $60,217 |
| Immigrants | Eritrea | 28.6 /100 | #188 | Fair $60,096 |
| Ghanaians | 27.5 /100 | #189 | Fair $60,043 |
| Puget Sound Salish | 25.3 /100 | #190 | Fair $59,934 |