Cuban vs Creek Householder Income Over 65 years
COMPARE
Cuban
Creek
Householder Income Over 65 years
Householder Income Over 65 years Comparison
Cubans
Creek
$49,152
HOUSEHOLDER INCOME OVER 65 YEARS
0.0/ 100
METRIC RATING
336th/ 347
METRIC RANK
$51,949
HOUSEHOLDER INCOME OVER 65 YEARS
0.0/ 100
METRIC RATING
316th/ 347
METRIC RANK
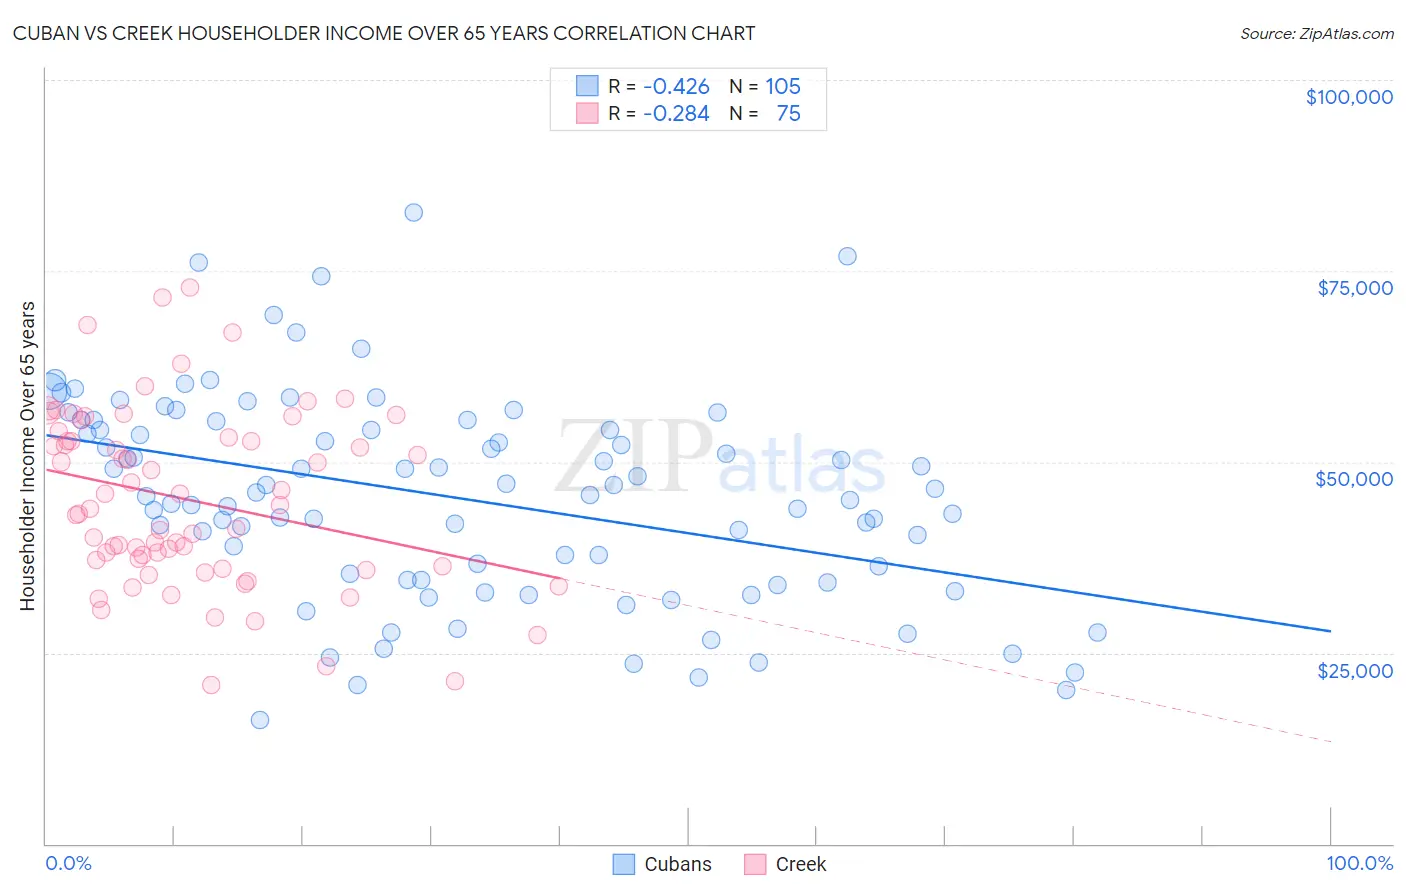
Cuban vs Creek Householder Income Over 65 years Correlation Chart
The statistical analysis conducted on geographies consisting of 447,397,071 people shows a moderate negative correlation between the proportion of Cubans and household income with householder over the age of 65 in the United States with a correlation coefficient (R) of -0.426 and weighted average of $49,152. Similarly, the statistical analysis conducted on geographies consisting of 178,125,248 people shows a weak negative correlation between the proportion of Creek and household income with householder over the age of 65 in the United States with a correlation coefficient (R) of -0.284 and weighted average of $51,949, a difference of 5.7%.
Householder Income Over 65 years Correlation Summary
| Measurement | Cuban | Creek |
| Minimum | $16,239 | $20,781 |
| Maximum | $82,682 | $72,903 |
| Range | $66,443 | $52,122 |
| Mean | $45,309 | $45,013 |
| Median | $45,658 | $43,886 |
| Interquartile 25% (IQ1) | $34,482 | $36,375 |
| Interquartile 75% (IQ3) | $54,771 | $53,125 |
| Interquartile Range (IQR) | $20,289 | $16,750 |
| Standard Deviation (Sample) | $13,460 | $11,525 |
| Standard Deviation (Population) | $13,396 | $11,448 |
Demographics Similar to Cubans and Creek by Householder Income Over 65 years
In terms of householder income over 65 years, the demographic groups most similar to Cubans are Crow ($49,234, a difference of 0.17%), Immigrants from Dominica ($50,071, a difference of 1.9%), Cape Verdean ($50,077, a difference of 1.9%), Dutch West Indian ($50,475, a difference of 2.7%), and Pima ($50,539, a difference of 2.8%). Similarly, the demographic groups most similar to Creek are Immigrants from St. Vincent and the Grenadines ($51,922, a difference of 0.050%), Haitian ($51,912, a difference of 0.070%), Immigrants from Honduras ($51,888, a difference of 0.12%), Colville ($51,739, a difference of 0.41%), and Menominee ($51,719, a difference of 0.45%).
| Demographics | Rating | Rank | Householder Income Over 65 years |
| Creek | 0.0 /100 | #316 | Tragic $51,949 |
| Immigrants | St. Vincent and the Grenadines | 0.0 /100 | #317 | Tragic $51,922 |
| Haitians | 0.0 /100 | #318 | Tragic $51,912 |
| Immigrants | Honduras | 0.0 /100 | #319 | Tragic $51,888 |
| Colville | 0.0 /100 | #320 | Tragic $51,739 |
| Menominee | 0.0 /100 | #321 | Tragic $51,719 |
| British West Indians | 0.0 /100 | #322 | Tragic $51,463 |
| Cajuns | 0.0 /100 | #323 | Tragic $51,397 |
| Immigrants | Congo | 0.0 /100 | #324 | Tragic $51,393 |
| Immigrants | Haiti | 0.0 /100 | #325 | Tragic $51,219 |
| Kiowa | 0.0 /100 | #326 | Tragic $51,140 |
| Bahamians | 0.0 /100 | #327 | Tragic $51,000 |
| Hopi | 0.0 /100 | #328 | Tragic $50,925 |
| Blacks/African Americans | 0.0 /100 | #329 | Tragic $50,779 |
| Immigrants | Grenada | 0.0 /100 | #330 | Tragic $50,747 |
| Pima | 0.0 /100 | #331 | Tragic $50,539 |
| Dutch West Indians | 0.0 /100 | #332 | Tragic $50,475 |
| Cape Verdeans | 0.0 /100 | #333 | Tragic $50,077 |
| Immigrants | Dominica | 0.0 /100 | #334 | Tragic $50,071 |
| Crow | 0.0 /100 | #335 | Tragic $49,234 |
| Cubans | 0.0 /100 | #336 | Tragic $49,152 |