Croatian vs Immigrants from Oceania Single Mother Households
COMPARE
Croatian
Immigrants from Oceania
Single Mother Households
Single Mother Households Comparison
Croatians
Immigrants from Oceania
5.5%
SINGLE MOTHER HOUSEHOLDS
99.3/ 100
METRIC RATING
46th/ 347
METRIC RANK
6.3%
SINGLE MOTHER HOUSEHOLDS
54.6/ 100
METRIC RATING
170th/ 347
METRIC RANK
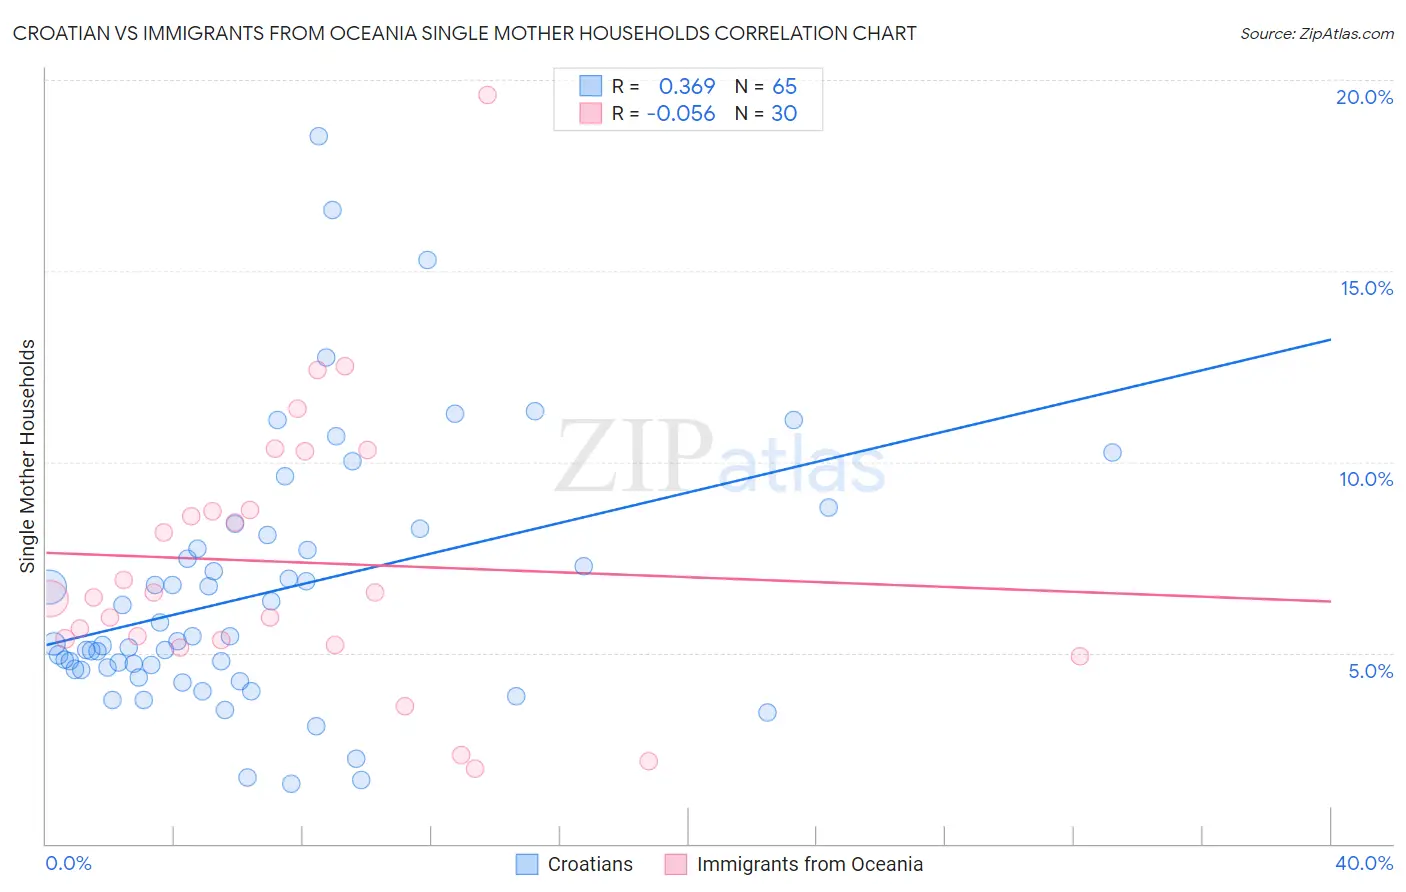
Croatian vs Immigrants from Oceania Single Mother Households Correlation Chart
The statistical analysis conducted on geographies consisting of 374,465,881 people shows a mild positive correlation between the proportion of Croatians and percentage of single mother households in the United States with a correlation coefficient (R) of 0.369 and weighted average of 5.5%. Similarly, the statistical analysis conducted on geographies consisting of 304,825,048 people shows a slight negative correlation between the proportion of Immigrants from Oceania and percentage of single mother households in the United States with a correlation coefficient (R) of -0.056 and weighted average of 6.3%, a difference of 15.1%.
Single Mother Households Correlation Summary
| Measurement | Croatian | Immigrants from Oceania |
| Minimum | 1.6% | 2.0% |
| Maximum | 18.5% | 19.6% |
| Range | 16.9% | 17.6% |
| Mean | 6.6% | 7.4% |
| Median | 5.3% | 6.5% |
| Interquartile 25% (IQ1) | 4.6% | 5.3% |
| Interquartile 75% (IQ3) | 7.9% | 8.7% |
| Interquartile Range (IQR) | 3.4% | 3.4% |
| Standard Deviation (Sample) | 3.4% | 3.6% |
| Standard Deviation (Population) | 3.4% | 3.6% |
Similar Demographics by Single Mother Households
Demographics Similar to Croatians by Single Mother Households
In terms of single mother households, the demographic groups most similar to Croatians are Norwegian (5.5%, a difference of 0.18%), Immigrants from Croatia (5.4%, a difference of 0.26%), Lithuanian (5.4%, a difference of 0.38%), Turkish (5.5%, a difference of 0.38%), and Immigrants from Latvia (5.5%, a difference of 0.41%).
| Demographics | Rating | Rank | Single Mother Households |
| Immigrants | Sweden | 99.6 /100 | #39 | Exceptional 5.4% |
| Estonians | 99.6 /100 | #40 | Exceptional 5.4% |
| Immigrants | Greece | 99.5 /100 | #41 | Exceptional 5.4% |
| Macedonians | 99.5 /100 | #42 | Exceptional 5.4% |
| Immigrants | South Central Asia | 99.5 /100 | #43 | Exceptional 5.4% |
| Lithuanians | 99.4 /100 | #44 | Exceptional 5.4% |
| Immigrants | Croatia | 99.4 /100 | #45 | Exceptional 5.4% |
| Croatians | 99.3 /100 | #46 | Exceptional 5.5% |
| Norwegians | 99.3 /100 | #47 | Exceptional 5.5% |
| Turks | 99.2 /100 | #48 | Exceptional 5.5% |
| Immigrants | Latvia | 99.2 /100 | #49 | Exceptional 5.5% |
| Immigrants | Scotland | 99.2 /100 | #50 | Exceptional 5.5% |
| Immigrants | Belarus | 99.2 /100 | #51 | Exceptional 5.5% |
| Swedes | 99.1 /100 | #52 | Exceptional 5.5% |
| Immigrants | Russia | 99.1 /100 | #53 | Exceptional 5.5% |
Demographics Similar to Immigrants from Oceania by Single Mother Households
In terms of single mother households, the demographic groups most similar to Immigrants from Oceania are Afghan (6.3%, a difference of 0.23%), Immigrants from South Eastern Asia (6.3%, a difference of 0.26%), Immigrants from Vietnam (6.3%, a difference of 0.34%), Puget Sound Salish (6.3%, a difference of 0.40%), and Immigrants from Chile (6.3%, a difference of 0.42%).
| Demographics | Rating | Rank | Single Mother Households |
| Alsatians | 68.7 /100 | #163 | Good 6.2% |
| Immigrants | Northern Africa | 68.0 /100 | #164 | Good 6.2% |
| Immigrants | Syria | 67.4 /100 | #165 | Good 6.2% |
| Sri Lankans | 63.9 /100 | #166 | Good 6.2% |
| Brazilians | 59.1 /100 | #167 | Average 6.2% |
| Immigrants | Chile | 58.3 /100 | #168 | Average 6.3% |
| Puget Sound Salish | 58.1 /100 | #169 | Average 6.3% |
| Immigrants | Oceania | 54.6 /100 | #170 | Average 6.3% |
| Afghans | 52.5 /100 | #171 | Average 6.3% |
| Immigrants | South Eastern Asia | 52.2 /100 | #172 | Average 6.3% |
| Immigrants | Vietnam | 51.5 /100 | #173 | Average 6.3% |
| Immigrants | Morocco | 50.0 /100 | #174 | Average 6.3% |
| Marshallese | 45.8 /100 | #175 | Average 6.3% |
| Immigrants | Bosnia and Herzegovina | 44.3 /100 | #176 | Average 6.3% |
| Osage | 43.0 /100 | #177 | Average 6.4% |