Croatian vs Immigrants from Oceania Householder Income Ages 45 - 64 years
COMPARE
Croatian
Immigrants from Oceania
Householder Income Ages 45 - 64 years
Householder Income Ages 45 - 64 years Comparison
Croatians
Immigrants from Oceania
$108,383
HOUSEHOLDER INCOME AGES 45 - 64 YEARS
98.3/ 100
METRIC RATING
92nd/ 347
METRIC RANK
$103,705
HOUSEHOLDER INCOME AGES 45 - 64 YEARS
84.5/ 100
METRIC RATING
139th/ 347
METRIC RANK
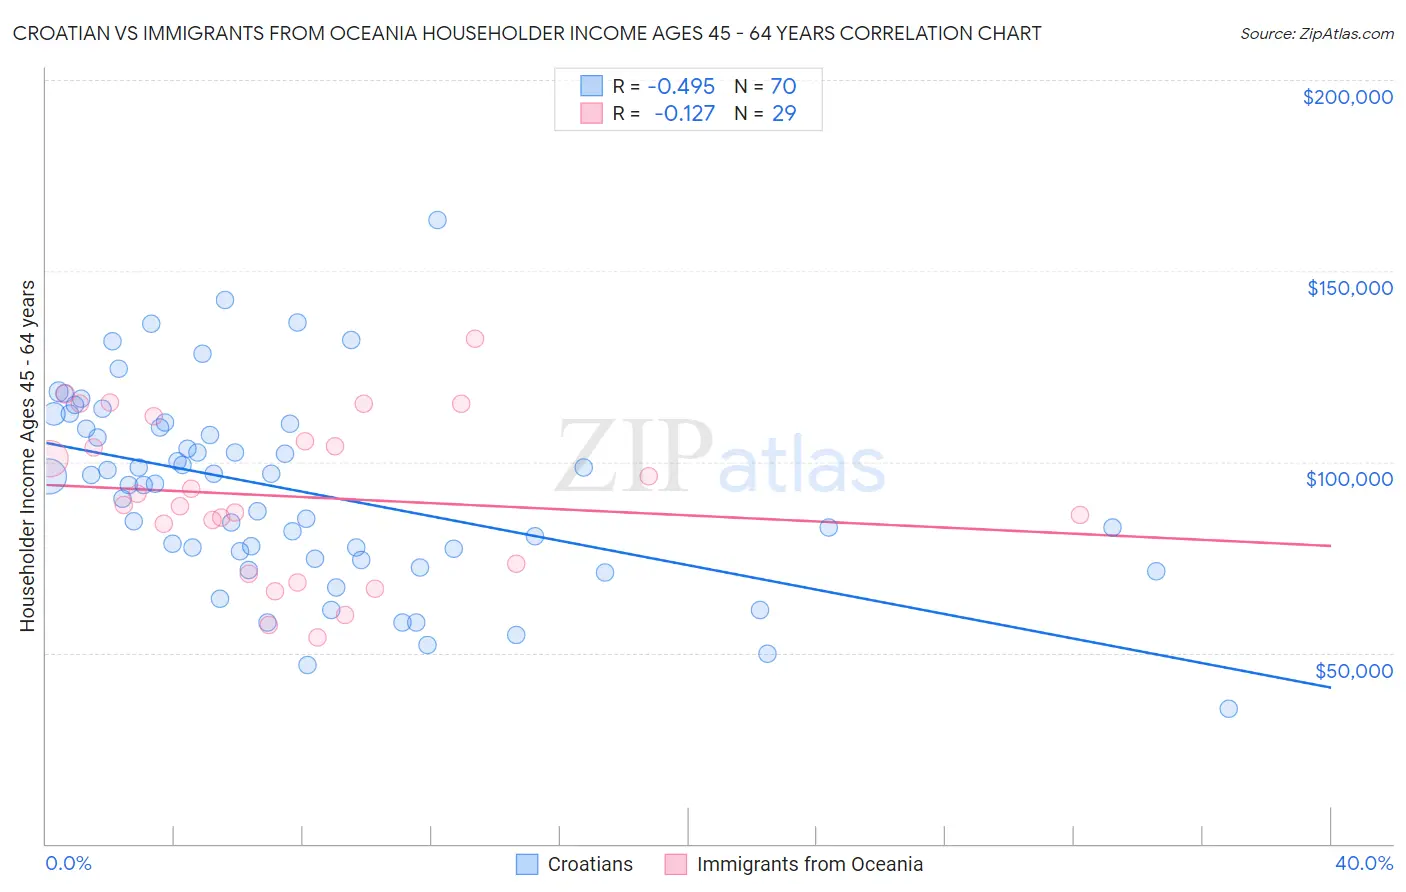
Croatian vs Immigrants from Oceania Householder Income Ages 45 - 64 years Correlation Chart
The statistical analysis conducted on geographies consisting of 375,164,056 people shows a moderate negative correlation between the proportion of Croatians and household income with householder between the ages 45 and 64 in the United States with a correlation coefficient (R) of -0.495 and weighted average of $108,383. Similarly, the statistical analysis conducted on geographies consisting of 305,099,752 people shows a poor negative correlation between the proportion of Immigrants from Oceania and household income with householder between the ages 45 and 64 in the United States with a correlation coefficient (R) of -0.127 and weighted average of $103,705, a difference of 4.5%.
Householder Income Ages 45 - 64 years Correlation Summary
| Measurement | Croatian | Immigrants from Oceania |
| Minimum | $35,326 | $53,935 |
| Maximum | $163,438 | $132,083 |
| Range | $128,112 | $78,148 |
| Mean | $92,198 | $90,991 |
| Median | $94,097 | $88,770 |
| Interquartile 25% (IQ1) | $74,551 | $72,125 |
| Interquartile 75% (IQ3) | $109,046 | $108,595 |
| Interquartile Range (IQR) | $34,495 | $36,470 |
| Standard Deviation (Sample) | $25,350 | $20,662 |
| Standard Deviation (Population) | $25,169 | $20,302 |
Similar Demographics by Householder Income Ages 45 - 64 years
Demographics Similar to Croatians by Householder Income Ages 45 - 64 years
In terms of householder income ages 45 - 64 years, the demographic groups most similar to Croatians are Immigrants from Croatia ($108,304, a difference of 0.070%), Ukrainian ($108,475, a difference of 0.080%), Immigrants from Philippines ($108,471, a difference of 0.080%), Immigrants from Lebanon ($108,471, a difference of 0.080%), and Sri Lankan ($108,270, a difference of 0.10%).
| Demographics | Rating | Rank | Householder Income Ages 45 - 64 years |
| Immigrants | Afghanistan | 98.6 /100 | #85 | Exceptional $108,785 |
| Austrians | 98.5 /100 | #86 | Exceptional $108,692 |
| Tongans | 98.5 /100 | #87 | Exceptional $108,643 |
| Romanians | 98.5 /100 | #88 | Exceptional $108,609 |
| Ukrainians | 98.3 /100 | #89 | Exceptional $108,475 |
| Immigrants | Philippines | 98.3 /100 | #90 | Exceptional $108,471 |
| Immigrants | Lebanon | 98.3 /100 | #91 | Exceptional $108,471 |
| Croatians | 98.3 /100 | #92 | Exceptional $108,383 |
| Immigrants | Croatia | 98.2 /100 | #93 | Exceptional $108,304 |
| Sri Lankans | 98.2 /100 | #94 | Exceptional $108,270 |
| Immigrants | Hungary | 98.2 /100 | #95 | Exceptional $108,267 |
| Immigrants | Argentina | 98.2 /100 | #96 | Exceptional $108,264 |
| Northern Europeans | 97.8 /100 | #97 | Exceptional $107,870 |
| Immigrants | Southern Europe | 97.7 /100 | #98 | Exceptional $107,775 |
| Palestinians | 97.6 /100 | #99 | Exceptional $107,721 |
Demographics Similar to Immigrants from Oceania by Householder Income Ages 45 - 64 years
In terms of householder income ages 45 - 64 years, the demographic groups most similar to Immigrants from Oceania are Norwegian ($103,682, a difference of 0.020%), Ethiopian ($103,736, a difference of 0.030%), Immigrants from Uganda ($103,584, a difference of 0.12%), Luxembourger ($103,536, a difference of 0.16%), and Serbian ($103,522, a difference of 0.18%).
| Demographics | Rating | Rank | Householder Income Ages 45 - 64 years |
| Lebanese | 90.1 /100 | #132 | Exceptional $104,734 |
| Arabs | 89.3 /100 | #133 | Excellent $104,566 |
| Canadians | 89.3 /100 | #134 | Excellent $104,560 |
| Brazilians | 88.6 /100 | #135 | Excellent $104,408 |
| Taiwanese | 87.4 /100 | #136 | Excellent $104,180 |
| Hungarians | 85.8 /100 | #137 | Excellent $103,913 |
| Ethiopians | 84.7 /100 | #138 | Excellent $103,736 |
| Immigrants | Oceania | 84.5 /100 | #139 | Excellent $103,705 |
| Norwegians | 84.3 /100 | #140 | Excellent $103,682 |
| Immigrants | Uganda | 83.7 /100 | #141 | Excellent $103,584 |
| Luxembourgers | 83.3 /100 | #142 | Excellent $103,536 |
| Serbians | 83.2 /100 | #143 | Excellent $103,522 |
| Czechs | 83.1 /100 | #144 | Excellent $103,507 |
| Ugandans | 82.9 /100 | #145 | Excellent $103,472 |
| Immigrants | Chile | 82.5 /100 | #146 | Excellent $103,412 |