Creek vs Immigrants from Scotland Per Capita Income
COMPARE
Creek
Immigrants from Scotland
Per Capita Income
Per Capita Income Comparison
Creek
Immigrants from Scotland
$35,546
PER CAPITA INCOME
0.0/ 100
METRIC RATING
322nd/ 347
METRIC RANK
$49,893
PER CAPITA INCOME
99.9/ 100
METRIC RATING
60th/ 347
METRIC RANK
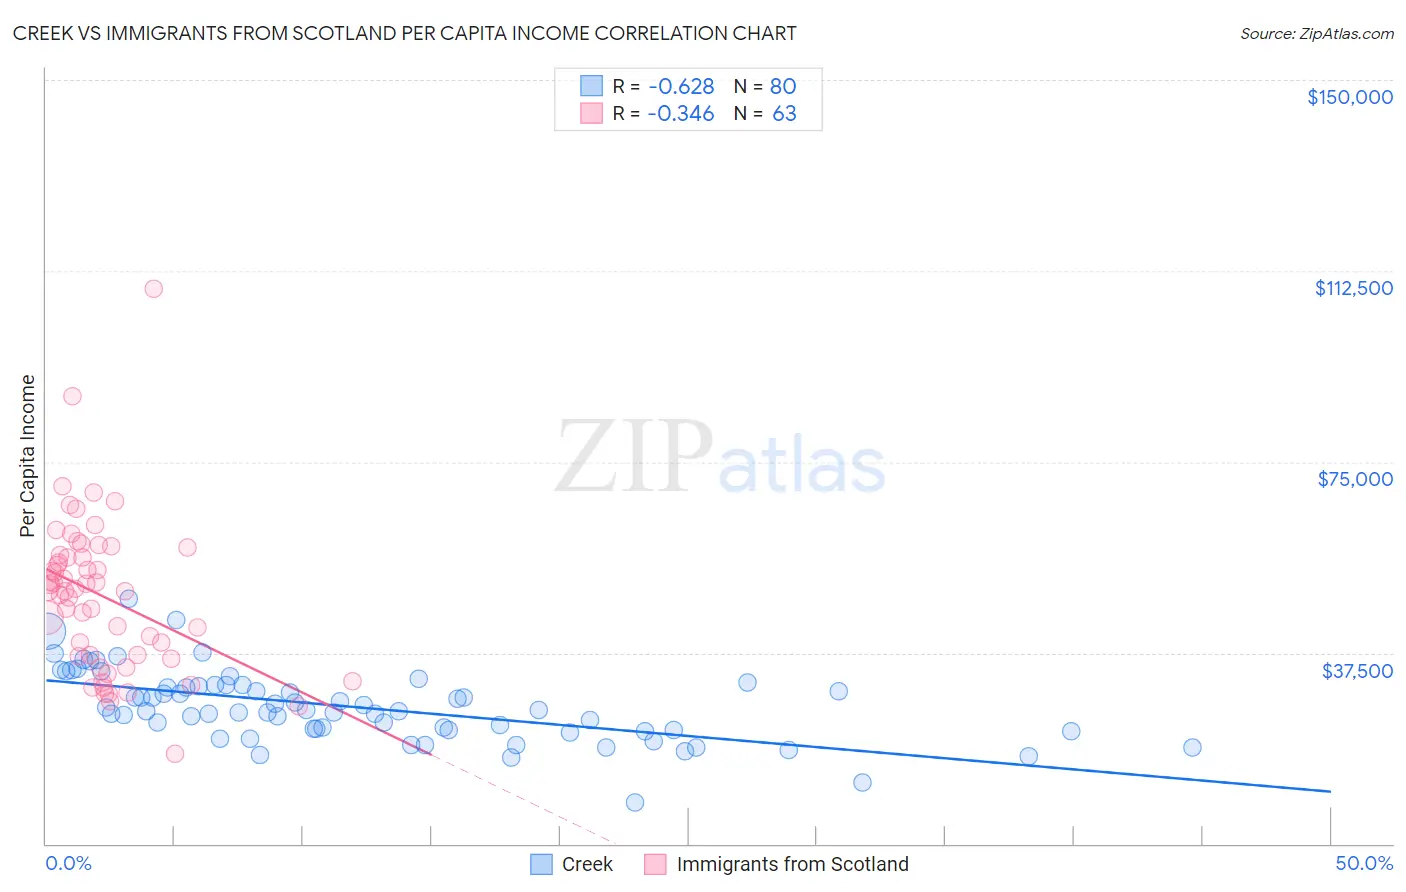
Creek vs Immigrants from Scotland Per Capita Income Correlation Chart
The statistical analysis conducted on geographies consisting of 178,484,884 people shows a significant negative correlation between the proportion of Creek and per capita income in the United States with a correlation coefficient (R) of -0.628 and weighted average of $35,546. Similarly, the statistical analysis conducted on geographies consisting of 196,392,396 people shows a mild negative correlation between the proportion of Immigrants from Scotland and per capita income in the United States with a correlation coefficient (R) of -0.346 and weighted average of $49,893, a difference of 40.4%.
Per Capita Income Correlation Summary
| Measurement | Creek | Immigrants from Scotland |
| Minimum | $8,185 | $17,665 |
| Maximum | $48,038 | $108,962 |
| Range | $39,853 | $91,297 |
| Mean | $26,882 | $48,673 |
| Median | $26,137 | $49,771 |
| Interquartile 25% (IQ1) | $22,339 | $36,731 |
| Interquartile 75% (IQ3) | $30,941 | $56,663 |
| Interquartile Range (IQR) | $8,603 | $19,932 |
| Standard Deviation (Sample) | $6,895 | $15,263 |
| Standard Deviation (Population) | $6,852 | $15,141 |
Similar Demographics by Per Capita Income
Demographics Similar to Creek by Per Capita Income
In terms of per capita income, the demographic groups most similar to Creek are Black/African American ($35,564, a difference of 0.050%), Hispanic or Latino ($35,688, a difference of 0.40%), Immigrants from Congo ($35,720, a difference of 0.49%), Cheyenne ($35,276, a difference of 0.76%), and Bangladeshi ($35,897, a difference of 0.99%).
| Demographics | Rating | Rank | Per Capita Income |
| Yaqui | 0.0 /100 | #315 | Tragic $36,112 |
| Choctaw | 0.0 /100 | #316 | Tragic $35,999 |
| Dutch West Indians | 0.0 /100 | #317 | Tragic $35,922 |
| Bangladeshis | 0.0 /100 | #318 | Tragic $35,897 |
| Immigrants | Congo | 0.0 /100 | #319 | Tragic $35,720 |
| Hispanics or Latinos | 0.0 /100 | #320 | Tragic $35,688 |
| Blacks/African Americans | 0.0 /100 | #321 | Tragic $35,564 |
| Creek | 0.0 /100 | #322 | Tragic $35,546 |
| Cheyenne | 0.0 /100 | #323 | Tragic $35,276 |
| Kiowa | 0.0 /100 | #324 | Tragic $35,102 |
| Immigrants | Central America | 0.0 /100 | #325 | Tragic $34,974 |
| Immigrants | Cuba | 0.0 /100 | #326 | Tragic $34,910 |
| Apache | 0.0 /100 | #327 | Tragic $34,886 |
| Menominee | 0.0 /100 | #328 | Tragic $34,578 |
| Mexicans | 0.0 /100 | #329 | Tragic $34,559 |
Demographics Similar to Immigrants from Scotland by Per Capita Income
In terms of per capita income, the demographic groups most similar to Immigrants from Scotland are Bhutanese ($49,894, a difference of 0.0%), Argentinean ($49,862, a difference of 0.060%), Immigrants from Malaysia ($49,983, a difference of 0.18%), South African ($50,044, a difference of 0.30%), and Immigrants from Asia ($49,741, a difference of 0.31%).
| Demographics | Rating | Rank | Per Capita Income |
| Paraguayans | 99.9 /100 | #53 | Exceptional $50,385 |
| Immigrants | Belarus | 99.9 /100 | #54 | Exceptional $50,303 |
| Immigrants | Western Europe | 99.9 /100 | #55 | Exceptional $50,065 |
| Asians | 99.9 /100 | #56 | Exceptional $50,057 |
| South Africans | 99.9 /100 | #57 | Exceptional $50,044 |
| Immigrants | Malaysia | 99.9 /100 | #58 | Exceptional $49,983 |
| Bhutanese | 99.9 /100 | #59 | Exceptional $49,894 |
| Immigrants | Scotland | 99.9 /100 | #60 | Exceptional $49,893 |
| Argentineans | 99.9 /100 | #61 | Exceptional $49,862 |
| Immigrants | Asia | 99.9 /100 | #62 | Exceptional $49,741 |
| Maltese | 99.9 /100 | #63 | Exceptional $49,640 |
| Immigrants | Argentina | 99.9 /100 | #64 | Exceptional $49,627 |
| Bolivians | 99.9 /100 | #65 | Exceptional $49,526 |
| Immigrants | Bulgaria | 99.9 /100 | #66 | Exceptional $49,482 |
| Immigrants | Romania | 99.9 /100 | #67 | Exceptional $49,463 |