Creek vs Kenyan Per Capita Income
COMPARE
Creek
Kenyan
Per Capita Income
Per Capita Income Comparison
Creek
Kenyans
$35,546
PER CAPITA INCOME
0.0/ 100
METRIC RATING
322nd/ 347
METRIC RANK
$42,808
PER CAPITA INCOME
27.7/ 100
METRIC RATING
190th/ 347
METRIC RANK
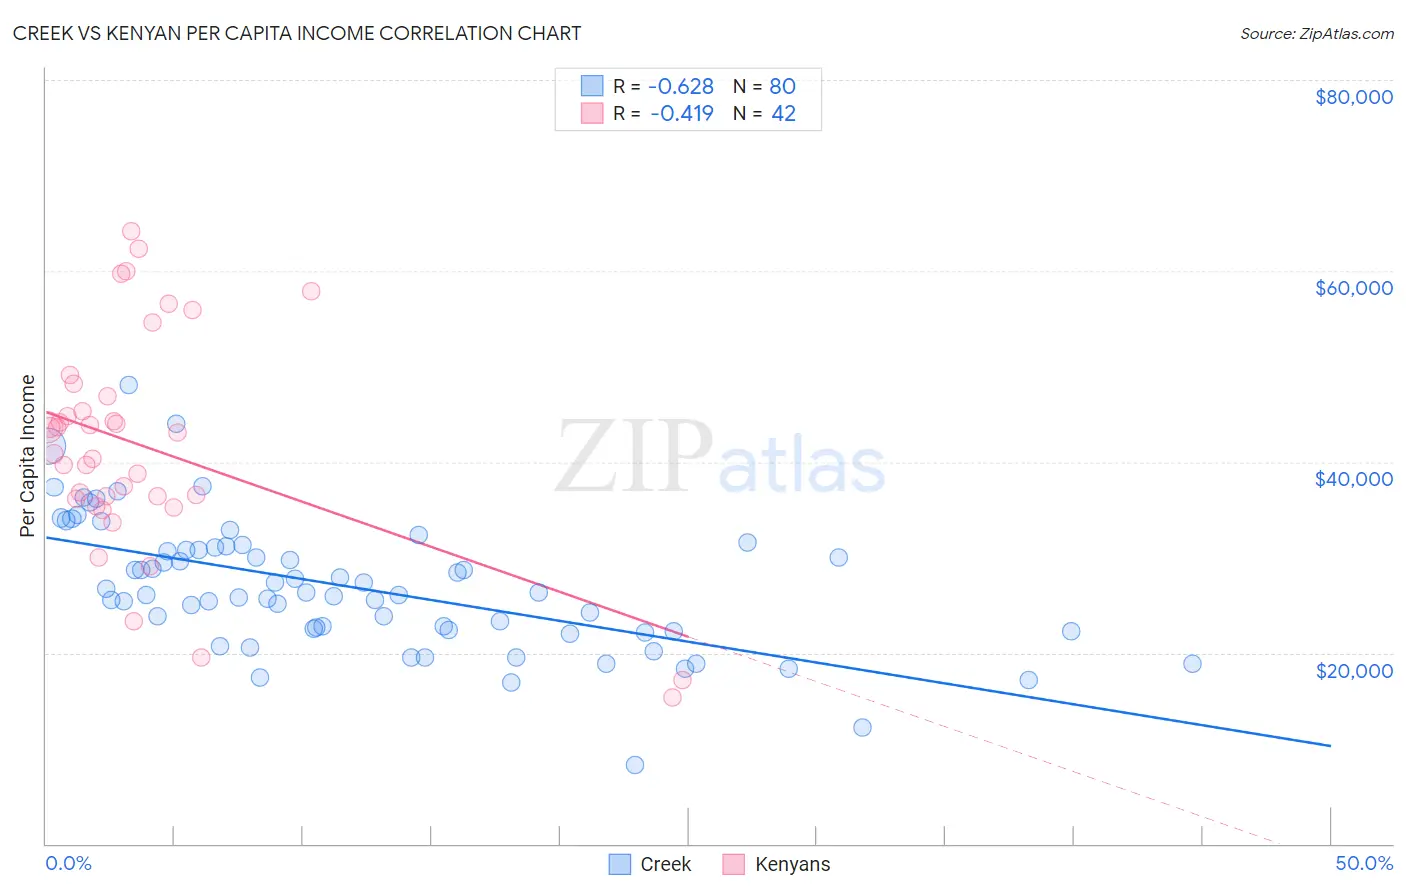
Creek vs Kenyan Per Capita Income Correlation Chart
The statistical analysis conducted on geographies consisting of 178,484,884 people shows a significant negative correlation between the proportion of Creek and per capita income in the United States with a correlation coefficient (R) of -0.628 and weighted average of $35,546. Similarly, the statistical analysis conducted on geographies consisting of 168,245,574 people shows a moderate negative correlation between the proportion of Kenyans and per capita income in the United States with a correlation coefficient (R) of -0.419 and weighted average of $42,808, a difference of 20.4%.
Per Capita Income Correlation Summary
| Measurement | Creek | Kenyan |
| Minimum | $8,185 | $15,366 |
| Maximum | $48,038 | $64,188 |
| Range | $39,853 | $48,822 |
| Mean | $26,882 | $41,624 |
| Median | $26,137 | $42,003 |
| Interquartile 25% (IQ1) | $22,339 | $36,158 |
| Interquartile 75% (IQ3) | $30,941 | $46,865 |
| Interquartile Range (IQR) | $8,603 | $10,707 |
| Standard Deviation (Sample) | $6,895 | $11,486 |
| Standard Deviation (Population) | $6,852 | $11,348 |
Similar Demographics by Per Capita Income
Demographics Similar to Creek by Per Capita Income
In terms of per capita income, the demographic groups most similar to Creek are Black/African American ($35,564, a difference of 0.050%), Hispanic or Latino ($35,688, a difference of 0.40%), Immigrants from Congo ($35,720, a difference of 0.49%), Cheyenne ($35,276, a difference of 0.76%), and Bangladeshi ($35,897, a difference of 0.99%).
| Demographics | Rating | Rank | Per Capita Income |
| Yaqui | 0.0 /100 | #315 | Tragic $36,112 |
| Choctaw | 0.0 /100 | #316 | Tragic $35,999 |
| Dutch West Indians | 0.0 /100 | #317 | Tragic $35,922 |
| Bangladeshis | 0.0 /100 | #318 | Tragic $35,897 |
| Immigrants | Congo | 0.0 /100 | #319 | Tragic $35,720 |
| Hispanics or Latinos | 0.0 /100 | #320 | Tragic $35,688 |
| Blacks/African Americans | 0.0 /100 | #321 | Tragic $35,564 |
| Creek | 0.0 /100 | #322 | Tragic $35,546 |
| Cheyenne | 0.0 /100 | #323 | Tragic $35,276 |
| Kiowa | 0.0 /100 | #324 | Tragic $35,102 |
| Immigrants | Central America | 0.0 /100 | #325 | Tragic $34,974 |
| Immigrants | Cuba | 0.0 /100 | #326 | Tragic $34,910 |
| Apache | 0.0 /100 | #327 | Tragic $34,886 |
| Menominee | 0.0 /100 | #328 | Tragic $34,578 |
| Mexicans | 0.0 /100 | #329 | Tragic $34,559 |
Demographics Similar to Kenyans by Per Capita Income
In terms of per capita income, the demographic groups most similar to Kenyans are Yugoslavian ($42,792, a difference of 0.040%), Iraqi ($42,760, a difference of 0.11%), Immigrants from Sierra Leone ($42,752, a difference of 0.13%), Bermudan ($42,911, a difference of 0.24%), and Immigrants from Fiji ($42,694, a difference of 0.27%).
| Demographics | Rating | Rank | Per Capita Income |
| Germans | 33.9 /100 | #183 | Fair $43,067 |
| Spaniards | 32.9 /100 | #184 | Fair $43,028 |
| Immigrants | Immigrants | 32.5 /100 | #185 | Fair $43,010 |
| French Canadians | 32.3 /100 | #186 | Fair $43,003 |
| Immigrants | Colombia | 31.5 /100 | #187 | Fair $42,971 |
| Immigrants | Africa | 31.0 /100 | #188 | Fair $42,950 |
| Bermudans | 30.1 /100 | #189 | Fair $42,911 |
| Kenyans | 27.7 /100 | #190 | Fair $42,808 |
| Yugoslavians | 27.4 /100 | #191 | Fair $42,792 |
| Iraqis | 26.7 /100 | #192 | Fair $42,760 |
| Immigrants | Sierra Leone | 26.5 /100 | #193 | Fair $42,752 |
| Immigrants | Fiji | 25.2 /100 | #194 | Fair $42,694 |
| Immigrants | Kenya | 24.5 /100 | #195 | Fair $42,661 |
| Dutch | 23.4 /100 | #196 | Fair $42,605 |
| Scotch-Irish | 22.6 /100 | #197 | Fair $42,563 |