Creek vs Osage Median Family Income
COMPARE
Creek
Osage
Median Family Income
Median Family Income Comparison
Creek
Osage
$82,560
MEDIAN FAMILY INCOME
0.0/ 100
METRIC RATING
324th/ 347
METRIC RANK
$91,926
MEDIAN FAMILY INCOME
0.4/ 100
METRIC RATING
258th/ 347
METRIC RANK
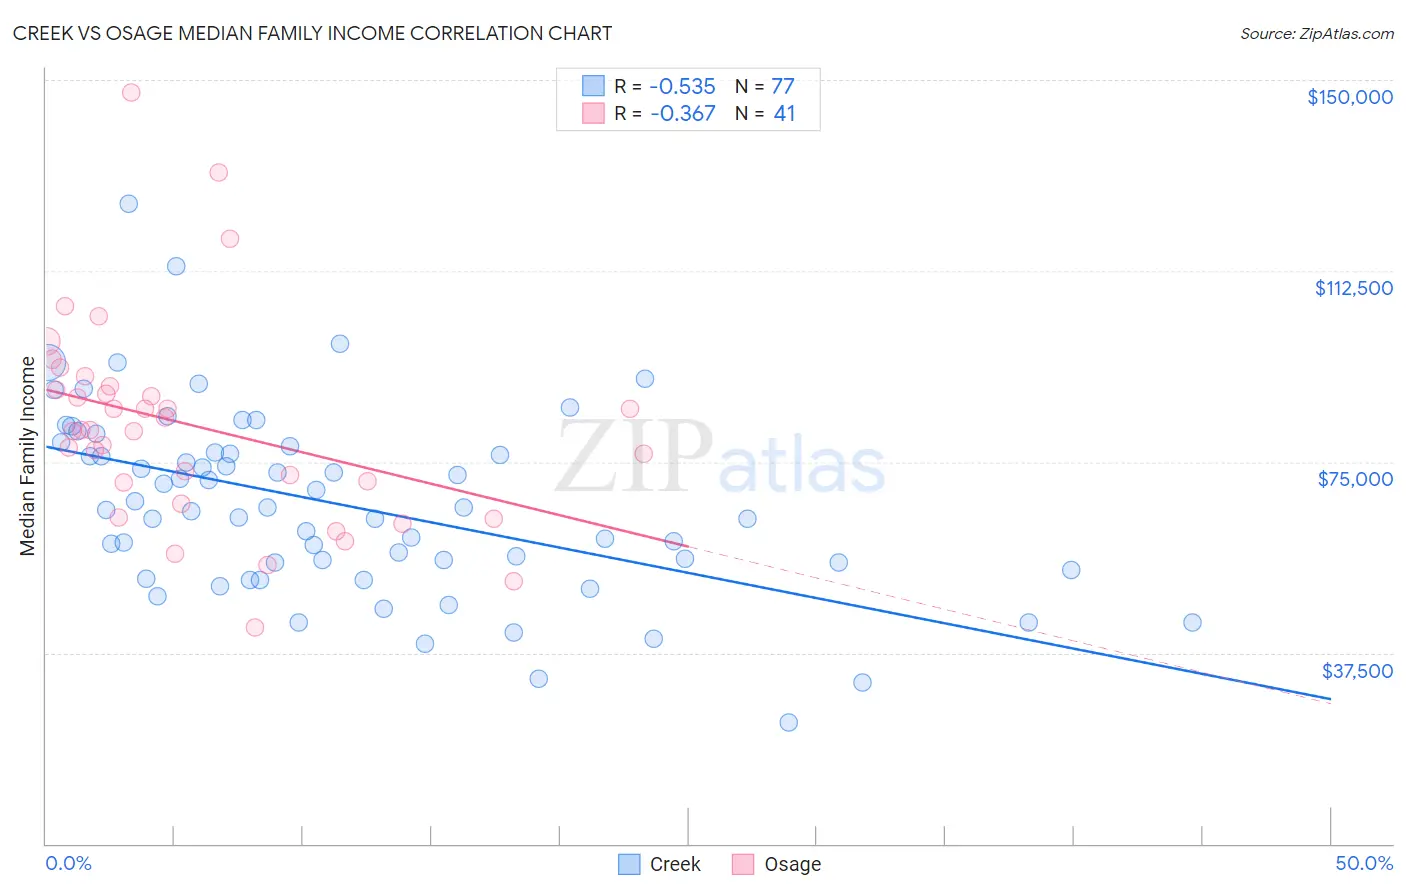
Creek vs Osage Median Family Income Correlation Chart
The statistical analysis conducted on geographies consisting of 178,420,625 people shows a substantial negative correlation between the proportion of Creek and median family income in the United States with a correlation coefficient (R) of -0.535 and weighted average of $82,560. Similarly, the statistical analysis conducted on geographies consisting of 91,794,477 people shows a mild negative correlation between the proportion of Osage and median family income in the United States with a correlation coefficient (R) of -0.367 and weighted average of $91,926, a difference of 11.3%.
Median Family Income Correlation Summary
| Measurement | Creek | Osage |
| Minimum | $23,750 | $42,500 |
| Maximum | $125,671 | $147,522 |
| Range | $101,921 | $105,022 |
| Mean | $66,532 | $81,978 |
| Median | $65,440 | $81,165 |
| Interquartile 25% (IQ1) | $54,458 | $68,927 |
| Interquartile 75% (IQ3) | $77,450 | $89,553 |
| Interquartile Range (IQR) | $22,992 | $20,626 |
| Standard Deviation (Sample) | $18,322 | $20,387 |
| Standard Deviation (Population) | $18,202 | $20,137 |
Similar Demographics by Median Family Income
Demographics Similar to Creek by Median Family Income
In terms of median family income, the demographic groups most similar to Creek are Bahamian ($82,631, a difference of 0.090%), Sioux ($82,386, a difference of 0.21%), Dominican ($82,888, a difference of 0.40%), Immigrants from Congo ($82,216, a difference of 0.42%), and Arapaho ($82,064, a difference of 0.61%).
| Demographics | Rating | Rank | Median Family Income |
| Yakama | 0.0 /100 | #317 | Tragic $83,932 |
| Immigrants | Mexico | 0.0 /100 | #318 | Tragic $83,639 |
| Immigrants | Honduras | 0.0 /100 | #319 | Tragic $83,618 |
| Seminole | 0.0 /100 | #320 | Tragic $83,354 |
| Immigrants | Caribbean | 0.0 /100 | #321 | Tragic $83,319 |
| Dominicans | 0.0 /100 | #322 | Tragic $82,888 |
| Bahamians | 0.0 /100 | #323 | Tragic $82,631 |
| Creek | 0.0 /100 | #324 | Tragic $82,560 |
| Sioux | 0.0 /100 | #325 | Tragic $82,386 |
| Immigrants | Congo | 0.0 /100 | #326 | Tragic $82,216 |
| Arapaho | 0.0 /100 | #327 | Tragic $82,064 |
| Blacks/African Americans | 0.0 /100 | #328 | Tragic $81,912 |
| Dutch West Indians | 0.0 /100 | #329 | Tragic $81,852 |
| Cheyenne | 0.0 /100 | #330 | Tragic $81,385 |
| Immigrants | Dominican Republic | 0.0 /100 | #331 | Tragic $81,233 |
Demographics Similar to Osage by Median Family Income
In terms of median family income, the demographic groups most similar to Osage are Cape Verdean ($91,848, a difference of 0.090%), Pennsylvania German ($91,763, a difference of 0.18%), American ($92,096, a difference of 0.19%), Inupiat ($91,730, a difference of 0.21%), and Liberian ($91,722, a difference of 0.22%).
| Demographics | Rating | Rank | Median Family Income |
| Immigrants | Somalia | 0.6 /100 | #251 | Tragic $92,609 |
| Immigrants | El Salvador | 0.6 /100 | #252 | Tragic $92,545 |
| Immigrants | Guyana | 0.6 /100 | #253 | Tragic $92,513 |
| Immigrants | Barbados | 0.5 /100 | #254 | Tragic $92,419 |
| Immigrants | Laos | 0.5 /100 | #255 | Tragic $92,239 |
| Nicaraguans | 0.5 /100 | #256 | Tragic $92,231 |
| Americans | 0.4 /100 | #257 | Tragic $92,096 |
| Osage | 0.4 /100 | #258 | Tragic $91,926 |
| Cape Verdeans | 0.4 /100 | #259 | Tragic $91,848 |
| Pennsylvania Germans | 0.4 /100 | #260 | Tragic $91,763 |
| Inupiat | 0.4 /100 | #261 | Tragic $91,730 |
| Liberians | 0.4 /100 | #262 | Tragic $91,722 |
| Immigrants | West Indies | 0.3 /100 | #263 | Tragic $91,588 |
| Senegalese | 0.3 /100 | #264 | Tragic $91,475 |
| Hmong | 0.3 /100 | #265 | Tragic $91,296 |