Creek vs New Zealander Median Family Income
COMPARE
Creek
New Zealander
Median Family Income
Median Family Income Comparison
Creek
New Zealanders
$82,560
MEDIAN FAMILY INCOME
0.0/ 100
METRIC RATING
324th/ 347
METRIC RANK
$115,230
MEDIAN FAMILY INCOME
99.8/ 100
METRIC RATING
56th/ 347
METRIC RANK
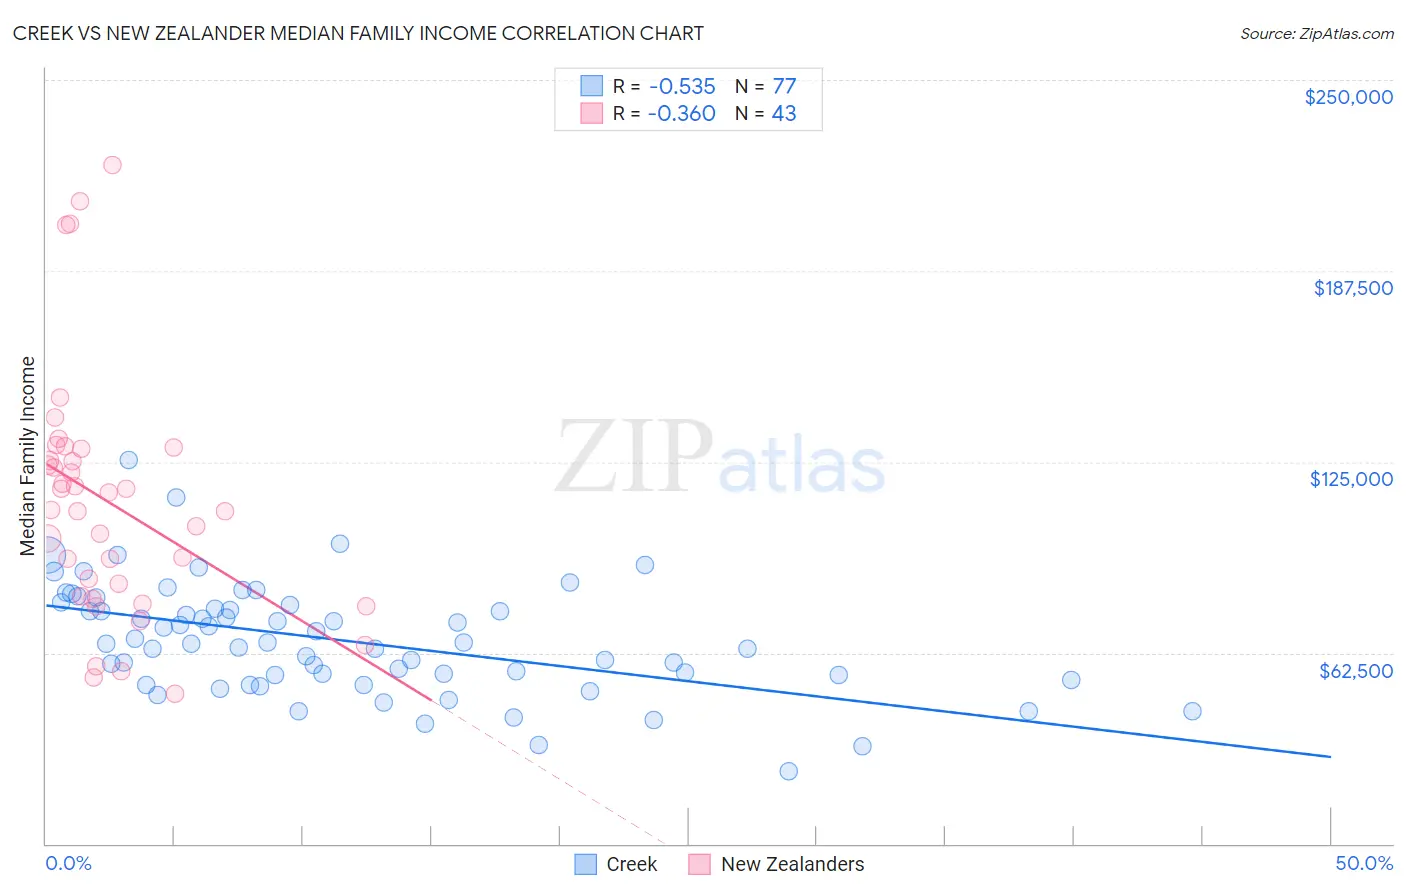
Creek vs New Zealander Median Family Income Correlation Chart
The statistical analysis conducted on geographies consisting of 178,420,625 people shows a substantial negative correlation between the proportion of Creek and median family income in the United States with a correlation coefficient (R) of -0.535 and weighted average of $82,560. Similarly, the statistical analysis conducted on geographies consisting of 106,887,889 people shows a mild negative correlation between the proportion of New Zealanders and median family income in the United States with a correlation coefficient (R) of -0.360 and weighted average of $115,230, a difference of 39.6%.
Median Family Income Correlation Summary
| Measurement | Creek | New Zealander |
| Minimum | $23,750 | $49,107 |
| Maximum | $125,671 | $222,283 |
| Range | $101,921 | $173,176 |
| Mean | $66,532 | $111,963 |
| Median | $65,440 | $109,262 |
| Interquartile 25% (IQ1) | $54,458 | $80,824 |
| Interquartile 75% (IQ3) | $77,450 | $129,386 |
| Interquartile Range (IQR) | $22,992 | $48,562 |
| Standard Deviation (Sample) | $18,322 | $40,212 |
| Standard Deviation (Population) | $18,202 | $39,742 |
Similar Demographics by Median Family Income
Demographics Similar to Creek by Median Family Income
In terms of median family income, the demographic groups most similar to Creek are Bahamian ($82,631, a difference of 0.090%), Sioux ($82,386, a difference of 0.21%), Dominican ($82,888, a difference of 0.40%), Immigrants from Congo ($82,216, a difference of 0.42%), and Arapaho ($82,064, a difference of 0.61%).
| Demographics | Rating | Rank | Median Family Income |
| Yakama | 0.0 /100 | #317 | Tragic $83,932 |
| Immigrants | Mexico | 0.0 /100 | #318 | Tragic $83,639 |
| Immigrants | Honduras | 0.0 /100 | #319 | Tragic $83,618 |
| Seminole | 0.0 /100 | #320 | Tragic $83,354 |
| Immigrants | Caribbean | 0.0 /100 | #321 | Tragic $83,319 |
| Dominicans | 0.0 /100 | #322 | Tragic $82,888 |
| Bahamians | 0.0 /100 | #323 | Tragic $82,631 |
| Creek | 0.0 /100 | #324 | Tragic $82,560 |
| Sioux | 0.0 /100 | #325 | Tragic $82,386 |
| Immigrants | Congo | 0.0 /100 | #326 | Tragic $82,216 |
| Arapaho | 0.0 /100 | #327 | Tragic $82,064 |
| Blacks/African Americans | 0.0 /100 | #328 | Tragic $81,912 |
| Dutch West Indians | 0.0 /100 | #329 | Tragic $81,852 |
| Cheyenne | 0.0 /100 | #330 | Tragic $81,385 |
| Immigrants | Dominican Republic | 0.0 /100 | #331 | Tragic $81,233 |
Demographics Similar to New Zealanders by Median Family Income
In terms of median family income, the demographic groups most similar to New Zealanders are Greek ($115,192, a difference of 0.030%), Immigrants from Indonesia ($115,162, a difference of 0.060%), Lithuanian ($115,395, a difference of 0.14%), Immigrants from Netherlands ($114,987, a difference of 0.21%), and Immigrants from Europe ($115,523, a difference of 0.25%).
| Demographics | Rating | Rank | Median Family Income |
| Chinese | 99.9 /100 | #49 | Exceptional $116,188 |
| Immigrants | Czechoslovakia | 99.9 /100 | #50 | Exceptional $116,165 |
| Immigrants | Malaysia | 99.9 /100 | #51 | Exceptional $115,880 |
| Maltese | 99.9 /100 | #52 | Exceptional $115,862 |
| Immigrants | Norway | 99.9 /100 | #53 | Exceptional $115,847 |
| Immigrants | Europe | 99.9 /100 | #54 | Exceptional $115,523 |
| Lithuanians | 99.8 /100 | #55 | Exceptional $115,395 |
| New Zealanders | 99.8 /100 | #56 | Exceptional $115,230 |
| Greeks | 99.8 /100 | #57 | Exceptional $115,192 |
| Immigrants | Indonesia | 99.8 /100 | #58 | Exceptional $115,162 |
| Immigrants | Netherlands | 99.8 /100 | #59 | Exceptional $114,987 |
| Immigrants | Latvia | 99.8 /100 | #60 | Exceptional $114,826 |
| Immigrants | Belarus | 99.8 /100 | #61 | Exceptional $114,586 |
| Mongolians | 99.8 /100 | #62 | Exceptional $114,553 |
| Immigrants | Pakistan | 99.8 /100 | #63 | Exceptional $114,406 |