Creek vs Austrian Median Family Income
COMPARE
Creek
Austrian
Median Family Income
Median Family Income Comparison
Creek
Austrians
$82,560
MEDIAN FAMILY INCOME
0.0/ 100
METRIC RATING
324th/ 347
METRIC RANK
$111,306
MEDIAN FAMILY INCOME
98.8/ 100
METRIC RATING
87th/ 347
METRIC RANK
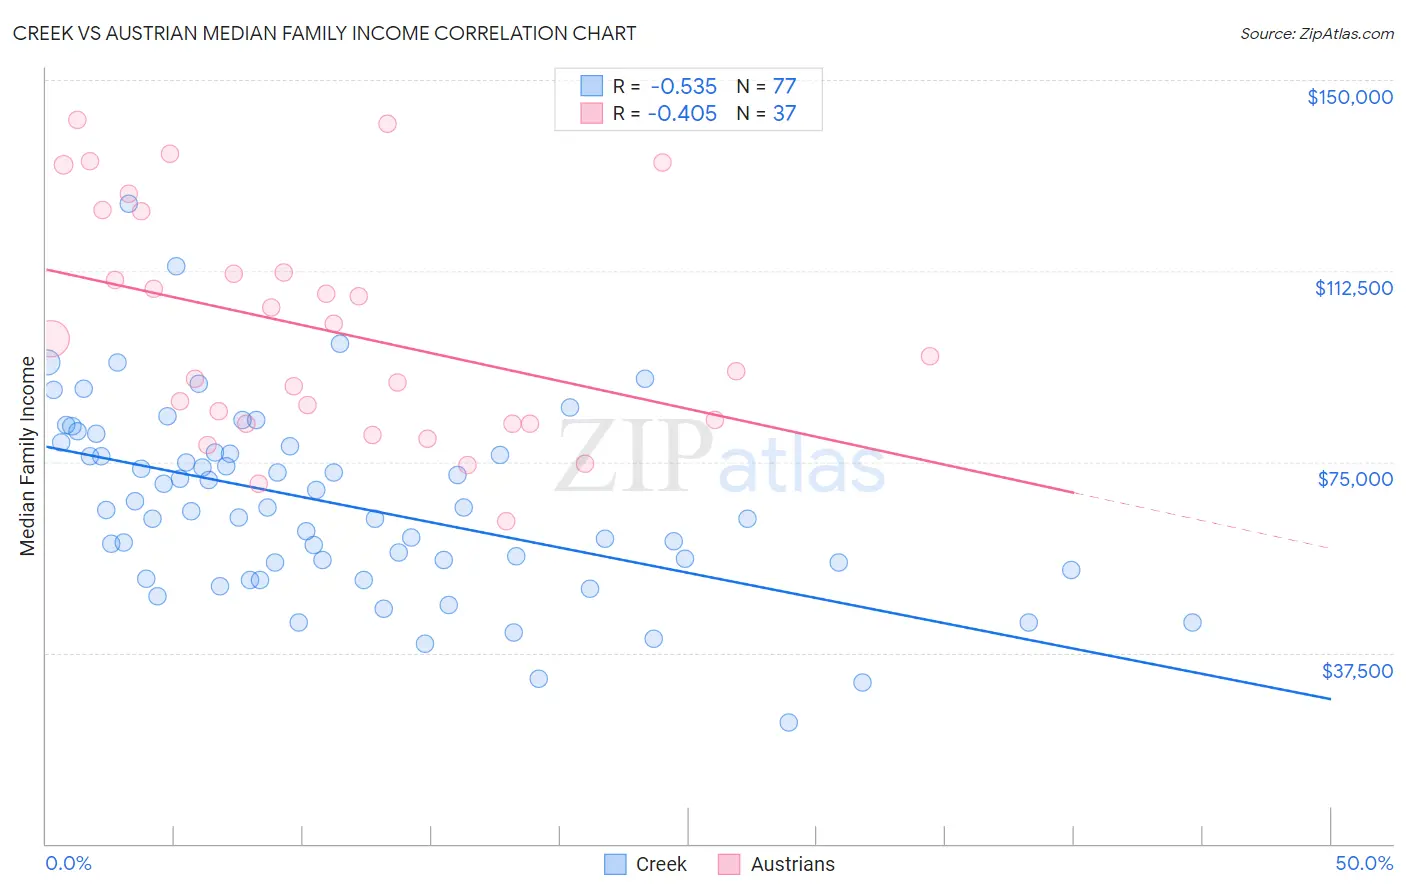
Creek vs Austrian Median Family Income Correlation Chart
The statistical analysis conducted on geographies consisting of 178,420,625 people shows a substantial negative correlation between the proportion of Creek and median family income in the United States with a correlation coefficient (R) of -0.535 and weighted average of $82,560. Similarly, the statistical analysis conducted on geographies consisting of 451,614,723 people shows a moderate negative correlation between the proportion of Austrians and median family income in the United States with a correlation coefficient (R) of -0.405 and weighted average of $111,306, a difference of 34.8%.
Median Family Income Correlation Summary
| Measurement | Creek | Austrian |
| Minimum | $23,750 | $63,235 |
| Maximum | $125,671 | $142,142 |
| Range | $101,921 | $78,907 |
| Mean | $66,532 | $100,879 |
| Median | $65,440 | $95,625 |
| Interquartile 25% (IQ1) | $54,458 | $82,447 |
| Interquartile 75% (IQ3) | $77,450 | $118,182 |
| Interquartile Range (IQR) | $22,992 | $35,735 |
| Standard Deviation (Sample) | $18,322 | $22,141 |
| Standard Deviation (Population) | $18,202 | $21,840 |
Similar Demographics by Median Family Income
Demographics Similar to Creek by Median Family Income
In terms of median family income, the demographic groups most similar to Creek are Bahamian ($82,631, a difference of 0.090%), Sioux ($82,386, a difference of 0.21%), Dominican ($82,888, a difference of 0.40%), Immigrants from Congo ($82,216, a difference of 0.42%), and Arapaho ($82,064, a difference of 0.61%).
| Demographics | Rating | Rank | Median Family Income |
| Yakama | 0.0 /100 | #317 | Tragic $83,932 |
| Immigrants | Mexico | 0.0 /100 | #318 | Tragic $83,639 |
| Immigrants | Honduras | 0.0 /100 | #319 | Tragic $83,618 |
| Seminole | 0.0 /100 | #320 | Tragic $83,354 |
| Immigrants | Caribbean | 0.0 /100 | #321 | Tragic $83,319 |
| Dominicans | 0.0 /100 | #322 | Tragic $82,888 |
| Bahamians | 0.0 /100 | #323 | Tragic $82,631 |
| Creek | 0.0 /100 | #324 | Tragic $82,560 |
| Sioux | 0.0 /100 | #325 | Tragic $82,386 |
| Immigrants | Congo | 0.0 /100 | #326 | Tragic $82,216 |
| Arapaho | 0.0 /100 | #327 | Tragic $82,064 |
| Blacks/African Americans | 0.0 /100 | #328 | Tragic $81,912 |
| Dutch West Indians | 0.0 /100 | #329 | Tragic $81,852 |
| Cheyenne | 0.0 /100 | #330 | Tragic $81,385 |
| Immigrants | Dominican Republic | 0.0 /100 | #331 | Tragic $81,233 |
Demographics Similar to Austrians by Median Family Income
In terms of median family income, the demographic groups most similar to Austrians are Immigrants from Hungary ($111,378, a difference of 0.060%), Croatian ($111,370, a difference of 0.060%), Ukrainian ($111,368, a difference of 0.060%), Romanian ($111,243, a difference of 0.060%), and Immigrants from Egypt ($111,689, a difference of 0.34%).
| Demographics | Rating | Rank | Median Family Income |
| Immigrants | Croatia | 99.3 /100 | #80 | Exceptional $112,323 |
| Immigrants | North America | 99.2 /100 | #81 | Exceptional $112,151 |
| Immigrants | England | 99.2 /100 | #82 | Exceptional $112,038 |
| Immigrants | Egypt | 99.0 /100 | #83 | Exceptional $111,689 |
| Immigrants | Hungary | 98.8 /100 | #84 | Exceptional $111,378 |
| Croatians | 98.8 /100 | #85 | Exceptional $111,370 |
| Ukrainians | 98.8 /100 | #86 | Exceptional $111,368 |
| Austrians | 98.8 /100 | #87 | Exceptional $111,306 |
| Romanians | 98.8 /100 | #88 | Exceptional $111,243 |
| Immigrants | Argentina | 98.5 /100 | #89 | Exceptional $110,873 |
| Northern Europeans | 98.3 /100 | #90 | Exceptional $110,635 |
| Immigrants | Southern Europe | 98.3 /100 | #91 | Exceptional $110,614 |
| Immigrants | Lebanon | 97.9 /100 | #92 | Exceptional $110,159 |
| Immigrants | Kazakhstan | 97.8 /100 | #93 | Exceptional $110,137 |
| Koreans | 97.8 /100 | #94 | Exceptional $110,103 |