Cree vs Immigrants from Western Asia Median Earnings
COMPARE
Cree
Immigrants from Western Asia
Median Earnings
Median Earnings Comparison
Cree
Immigrants from Western Asia
$42,777
MEDIAN EARNINGS
0.6/ 100
METRIC RATING
267th/ 347
METRIC RANK
$49,389
MEDIAN EARNINGS
98.4/ 100
METRIC RATING
105th/ 347
METRIC RANK
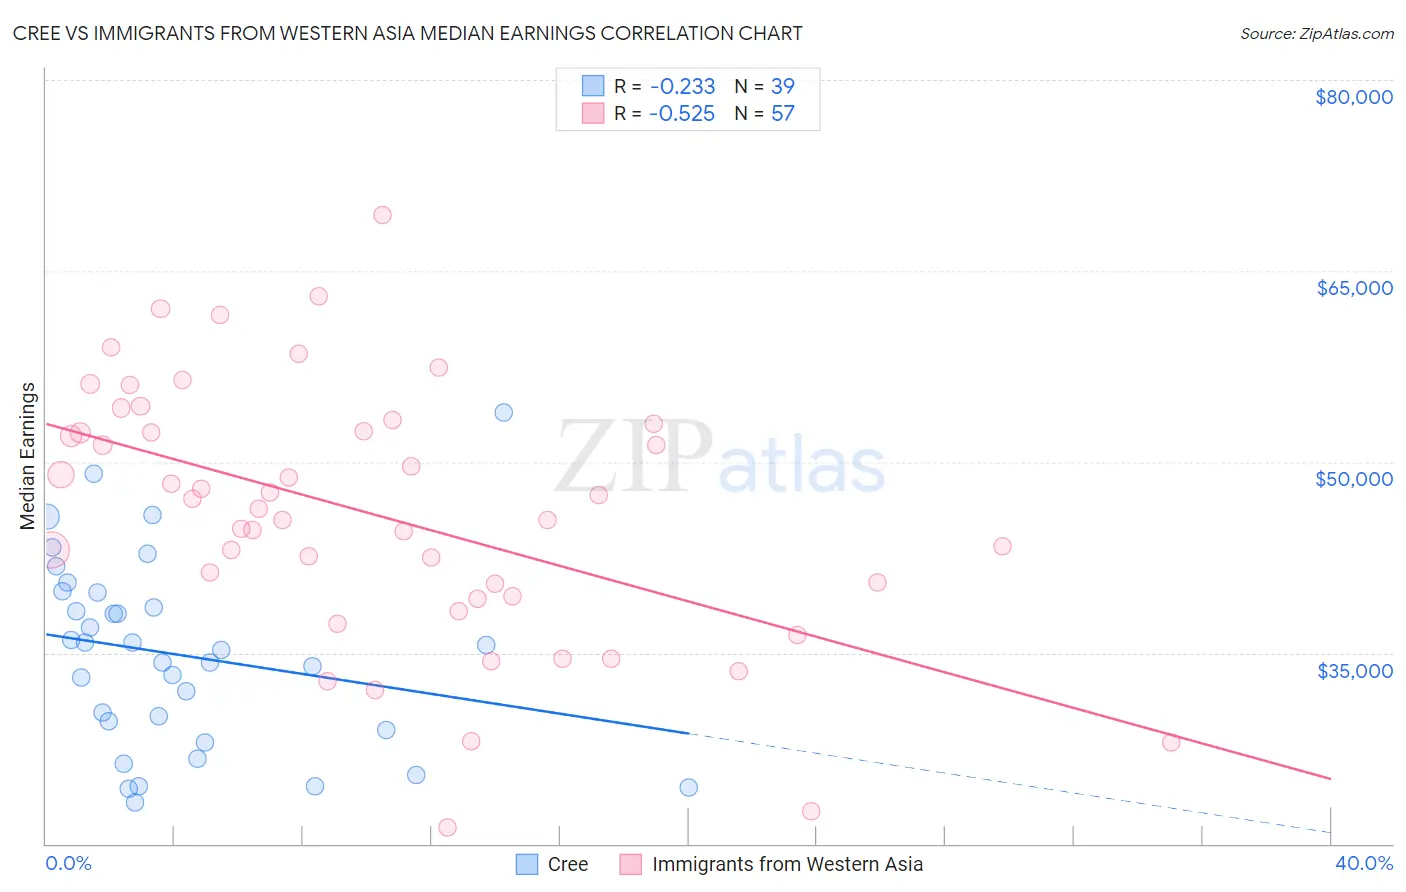
Cree vs Immigrants from Western Asia Median Earnings Correlation Chart
The statistical analysis conducted on geographies consisting of 76,210,467 people shows a weak negative correlation between the proportion of Cree and median earnings in the United States with a correlation coefficient (R) of -0.233 and weighted average of $42,777. Similarly, the statistical analysis conducted on geographies consisting of 404,426,866 people shows a substantial negative correlation between the proportion of Immigrants from Western Asia and median earnings in the United States with a correlation coefficient (R) of -0.525 and weighted average of $49,389, a difference of 15.5%.
Median Earnings Correlation Summary
| Measurement | Cree | Immigrants from Western Asia |
| Minimum | $23,200 | $21,250 |
| Maximum | $53,900 | $69,348 |
| Range | $30,700 | $48,098 |
| Mean | $34,814 | $45,817 |
| Median | $35,233 | $46,307 |
| Interquartile 25% (IQ1) | $28,896 | $39,374 |
| Interquartile 75% (IQ3) | $39,775 | $52,673 |
| Interquartile Range (IQR) | $10,879 | $13,299 |
| Standard Deviation (Sample) | $7,415 | $10,167 |
| Standard Deviation (Population) | $7,320 | $10,077 |
Similar Demographics by Median Earnings
Demographics Similar to Cree by Median Earnings
In terms of median earnings, the demographic groups most similar to Cree are American ($42,742, a difference of 0.080%), Belizean ($42,702, a difference of 0.17%), Immigrants from Laos ($42,884, a difference of 0.25%), Osage ($42,651, a difference of 0.29%), and Salvadoran ($42,912, a difference of 0.32%).
| Demographics | Rating | Rank | Median Earnings |
| Immigrants | Somalia | 0.9 /100 | #260 | Tragic $43,100 |
| Immigrants | Jamaica | 0.8 /100 | #261 | Tragic $43,026 |
| Nicaraguans | 0.8 /100 | #262 | Tragic $43,026 |
| Inupiat | 0.8 /100 | #263 | Tragic $43,000 |
| Immigrants | Liberia | 0.7 /100 | #264 | Tragic $42,923 |
| Salvadorans | 0.7 /100 | #265 | Tragic $42,912 |
| Immigrants | Laos | 0.7 /100 | #266 | Tragic $42,884 |
| Cree | 0.6 /100 | #267 | Tragic $42,777 |
| Americans | 0.6 /100 | #268 | Tragic $42,742 |
| Belizeans | 0.5 /100 | #269 | Tragic $42,702 |
| Osage | 0.5 /100 | #270 | Tragic $42,651 |
| Pennsylvania Germans | 0.5 /100 | #271 | Tragic $42,615 |
| Iroquois | 0.4 /100 | #272 | Tragic $42,430 |
| Immigrants | Dominica | 0.4 /100 | #273 | Tragic $42,420 |
| Immigrants | El Salvador | 0.4 /100 | #274 | Tragic $42,413 |
Demographics Similar to Immigrants from Western Asia by Median Earnings
In terms of median earnings, the demographic groups most similar to Immigrants from Western Asia are Immigrants from Albania ($49,377, a difference of 0.020%), Immigrants from Morocco ($49,368, a difference of 0.040%), Immigrants from Brazil ($49,463, a difference of 0.15%), Austrian ($49,501, a difference of 0.23%), and Ethiopian ($49,572, a difference of 0.37%).
| Demographics | Rating | Rank | Median Earnings |
| Immigrants | Northern Africa | 98.9 /100 | #98 | Exceptional $49,648 |
| Immigrants | Afghanistan | 98.9 /100 | #99 | Exceptional $49,645 |
| Immigrants | Poland | 98.9 /100 | #100 | Exceptional $49,633 |
| Jordanians | 98.9 /100 | #101 | Exceptional $49,632 |
| Ethiopians | 98.8 /100 | #102 | Exceptional $49,572 |
| Austrians | 98.7 /100 | #103 | Exceptional $49,501 |
| Immigrants | Brazil | 98.6 /100 | #104 | Exceptional $49,463 |
| Immigrants | Western Asia | 98.4 /100 | #105 | Exceptional $49,389 |
| Immigrants | Albania | 98.4 /100 | #106 | Exceptional $49,377 |
| Immigrants | Morocco | 98.4 /100 | #107 | Exceptional $49,368 |
| Palestinians | 98.0 /100 | #108 | Exceptional $49,209 |
| Syrians | 97.1 /100 | #109 | Exceptional $48,934 |
| Immigrants | Ethiopia | 97.1 /100 | #110 | Exceptional $48,924 |
| Immigrants | Zimbabwe | 97.0 /100 | #111 | Exceptional $48,913 |
| Northern Europeans | 96.9 /100 | #112 | Exceptional $48,887 |