Cree vs Immigrants from Kazakhstan Median Earnings
COMPARE
Cree
Immigrants from Kazakhstan
Median Earnings
Median Earnings Comparison
Cree
Immigrants from Kazakhstan
$42,777
MEDIAN EARNINGS
0.6/ 100
METRIC RATING
267th/ 347
METRIC RANK
$50,225
MEDIAN EARNINGS
99.5/ 100
METRIC RATING
85th/ 347
METRIC RANK
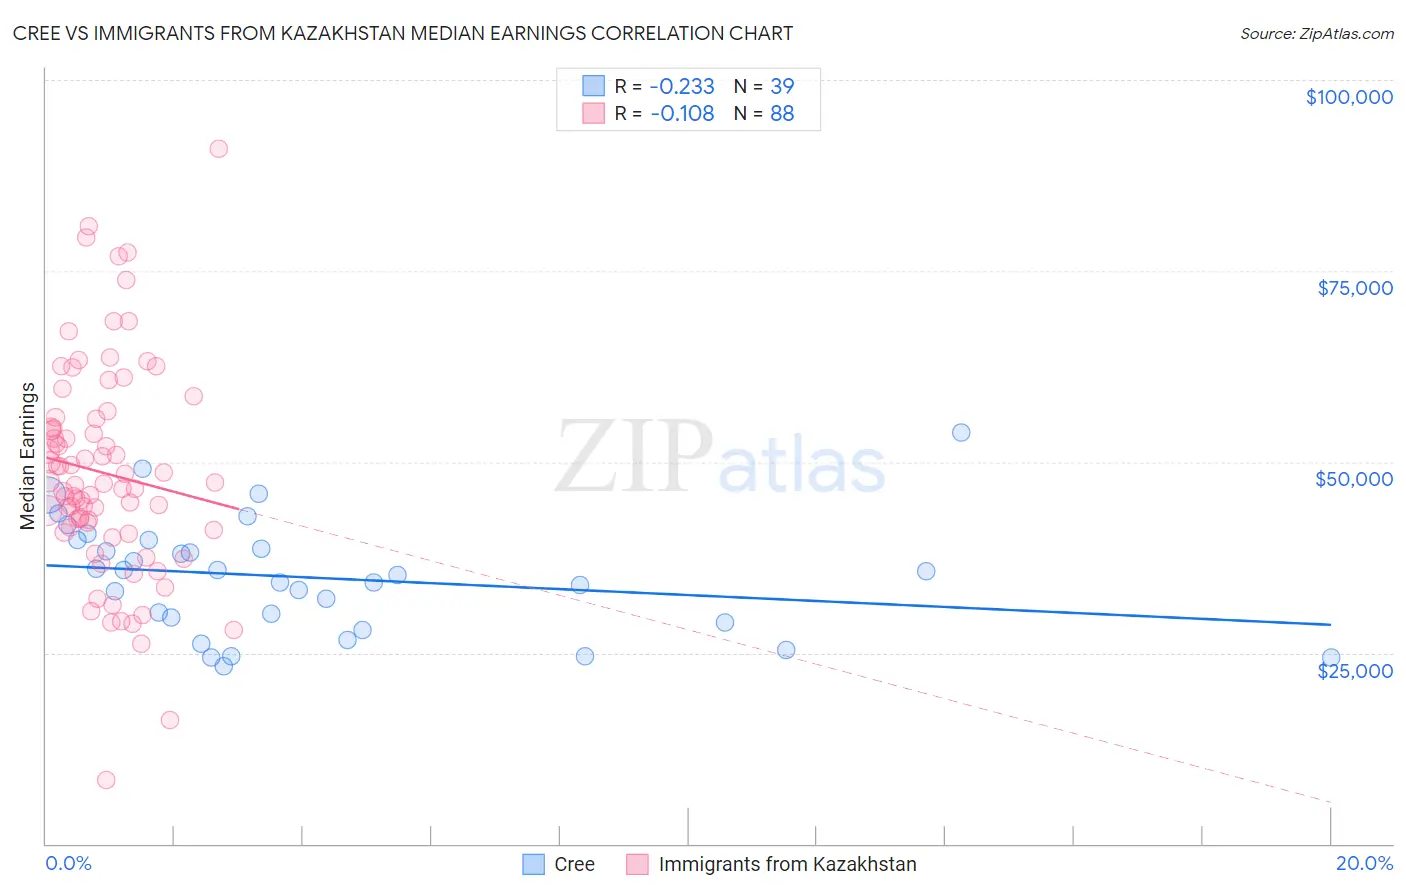
Cree vs Immigrants from Kazakhstan Median Earnings Correlation Chart
The statistical analysis conducted on geographies consisting of 76,210,467 people shows a weak negative correlation between the proportion of Cree and median earnings in the United States with a correlation coefficient (R) of -0.233 and weighted average of $42,777. Similarly, the statistical analysis conducted on geographies consisting of 124,433,453 people shows a poor negative correlation between the proportion of Immigrants from Kazakhstan and median earnings in the United States with a correlation coefficient (R) of -0.108 and weighted average of $50,225, a difference of 17.4%.
Median Earnings Correlation Summary
| Measurement | Cree | Immigrants from Kazakhstan |
| Minimum | $23,200 | $8,274 |
| Maximum | $53,900 | $91,080 |
| Range | $30,700 | $82,806 |
| Mean | $34,814 | $48,545 |
| Median | $35,233 | $47,134 |
| Interquartile 25% (IQ1) | $28,896 | $41,207 |
| Interquartile 75% (IQ3) | $39,775 | $55,074 |
| Interquartile Range (IQR) | $10,879 | $13,868 |
| Standard Deviation (Sample) | $7,415 | $14,031 |
| Standard Deviation (Population) | $7,320 | $13,951 |
Similar Demographics by Median Earnings
Demographics Similar to Cree by Median Earnings
In terms of median earnings, the demographic groups most similar to Cree are American ($42,742, a difference of 0.080%), Belizean ($42,702, a difference of 0.17%), Immigrants from Laos ($42,884, a difference of 0.25%), Osage ($42,651, a difference of 0.29%), and Salvadoran ($42,912, a difference of 0.32%).
| Demographics | Rating | Rank | Median Earnings |
| Immigrants | Somalia | 0.9 /100 | #260 | Tragic $43,100 |
| Immigrants | Jamaica | 0.8 /100 | #261 | Tragic $43,026 |
| Nicaraguans | 0.8 /100 | #262 | Tragic $43,026 |
| Inupiat | 0.8 /100 | #263 | Tragic $43,000 |
| Immigrants | Liberia | 0.7 /100 | #264 | Tragic $42,923 |
| Salvadorans | 0.7 /100 | #265 | Tragic $42,912 |
| Immigrants | Laos | 0.7 /100 | #266 | Tragic $42,884 |
| Cree | 0.6 /100 | #267 | Tragic $42,777 |
| Americans | 0.6 /100 | #268 | Tragic $42,742 |
| Belizeans | 0.5 /100 | #269 | Tragic $42,702 |
| Osage | 0.5 /100 | #270 | Tragic $42,651 |
| Pennsylvania Germans | 0.5 /100 | #271 | Tragic $42,615 |
| Iroquois | 0.4 /100 | #272 | Tragic $42,430 |
| Immigrants | Dominica | 0.4 /100 | #273 | Tragic $42,420 |
| Immigrants | El Salvador | 0.4 /100 | #274 | Tragic $42,413 |
Demographics Similar to Immigrants from Kazakhstan by Median Earnings
In terms of median earnings, the demographic groups most similar to Immigrants from Kazakhstan are Immigrants from Hungary ($50,227, a difference of 0.0%), Romanian ($50,244, a difference of 0.040%), Immigrants from Canada ($50,192, a difference of 0.070%), Immigrants from Moldova ($50,274, a difference of 0.10%), and Immigrants from Southern Europe ($50,280, a difference of 0.11%).
| Demographics | Rating | Rank | Median Earnings |
| Argentineans | 99.6 /100 | #78 | Exceptional $50,399 |
| Laotians | 99.6 /100 | #79 | Exceptional $50,343 |
| Ukrainians | 99.6 /100 | #80 | Exceptional $50,320 |
| Immigrants | Southern Europe | 99.6 /100 | #81 | Exceptional $50,280 |
| Immigrants | Moldova | 99.5 /100 | #82 | Exceptional $50,274 |
| Romanians | 99.5 /100 | #83 | Exceptional $50,244 |
| Immigrants | Hungary | 99.5 /100 | #84 | Exceptional $50,227 |
| Immigrants | Kazakhstan | 99.5 /100 | #85 | Exceptional $50,225 |
| Immigrants | Canada | 99.5 /100 | #86 | Exceptional $50,192 |
| Immigrants | Uzbekistan | 99.5 /100 | #87 | Exceptional $50,151 |
| Albanians | 99.4 /100 | #88 | Exceptional $50,116 |
| Immigrants | North America | 99.4 /100 | #89 | Exceptional $50,108 |
| Italians | 99.3 /100 | #90 | Exceptional $49,915 |
| Macedonians | 99.2 /100 | #91 | Exceptional $49,893 |
| Immigrants | Argentina | 99.2 /100 | #92 | Exceptional $49,841 |