Immigrants from Colombia vs Assyrian/Chaldean/Syriac Median Household Income
COMPARE
Immigrants from Colombia
Assyrian/Chaldean/Syriac
Median Household Income
Median Household Income Comparison
Immigrants from Colombia
Assyrians/Chaldeans/Syriacs
$83,902
MEDIAN HOUSEHOLD INCOME
31.7/ 100
METRIC RATING
189th/ 347
METRIC RANK
$91,991
MEDIAN HOUSEHOLD INCOME
98.8/ 100
METRIC RATING
90th/ 347
METRIC RANK
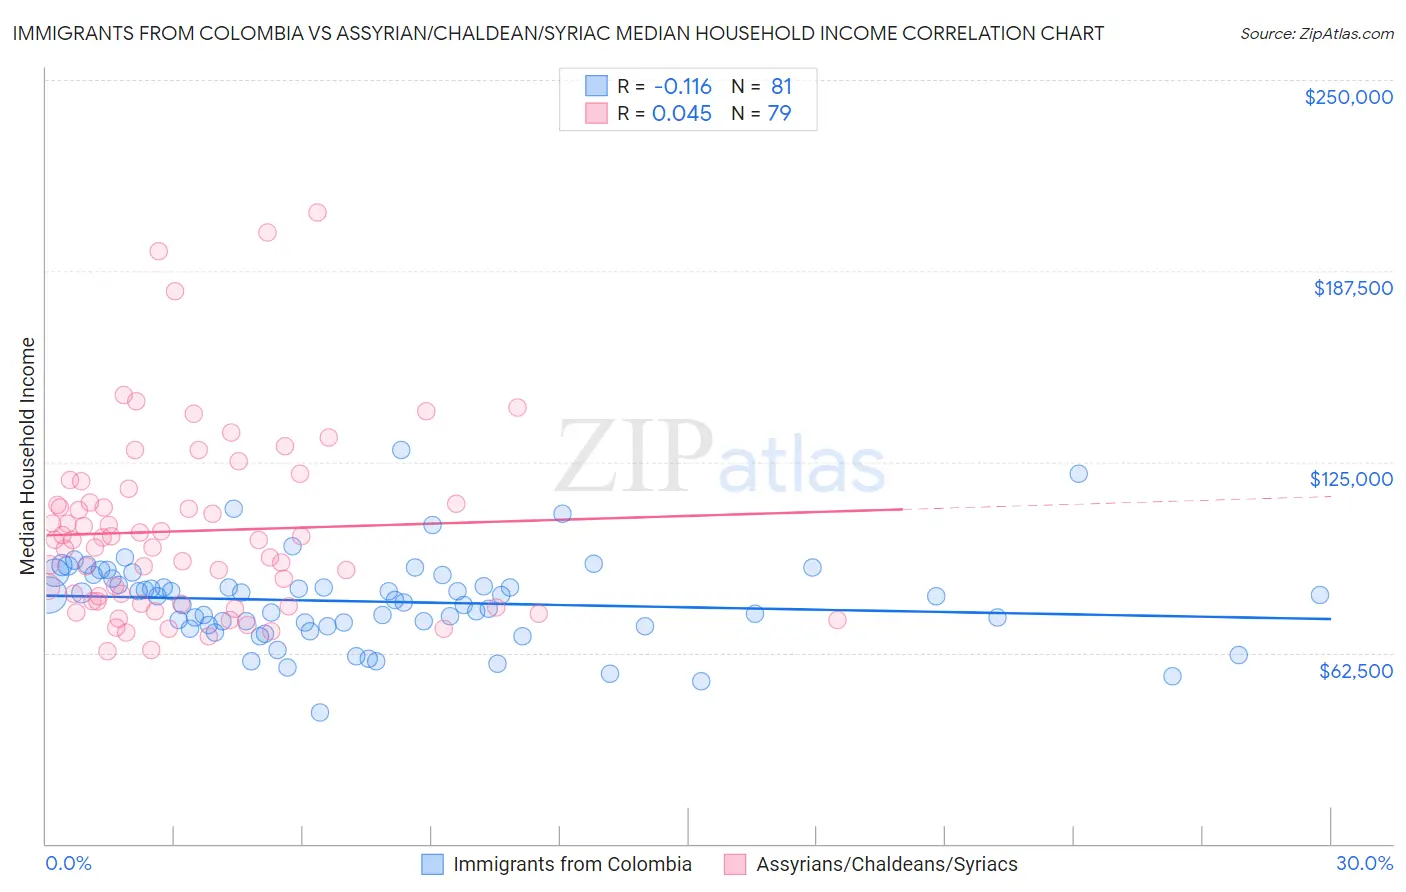
Immigrants from Colombia vs Assyrian/Chaldean/Syriac Median Household Income Correlation Chart
The statistical analysis conducted on geographies consisting of 378,453,155 people shows a poor negative correlation between the proportion of Immigrants from Colombia and median household income in the United States with a correlation coefficient (R) of -0.116 and weighted average of $83,902. Similarly, the statistical analysis conducted on geographies consisting of 110,256,349 people shows no correlation between the proportion of Assyrians/Chaldeans/Syriacs and median household income in the United States with a correlation coefficient (R) of 0.045 and weighted average of $91,991, a difference of 9.6%.
Median Household Income Correlation Summary
| Measurement | Immigrants from Colombia | Assyrian/Chaldean/Syriac |
| Minimum | $43,124 | $63,036 |
| Maximum | $128,990 | $206,750 |
| Range | $85,865 | $143,714 |
| Mean | $79,298 | $102,405 |
| Median | $80,865 | $99,390 |
| Interquartile 25% (IQ1) | $71,504 | $78,587 |
| Interquartile 75% (IQ3) | $87,336 | $111,848 |
| Interquartile Range (IQR) | $15,833 | $33,262 |
| Standard Deviation (Sample) | $14,245 | $30,418 |
| Standard Deviation (Population) | $14,157 | $30,225 |
Similar Demographics by Median Household Income
Demographics Similar to Immigrants from Colombia by Median Household Income
In terms of median household income, the demographic groups most similar to Immigrants from Colombia are Tlingit-Haida ($83,968, a difference of 0.080%), Slovak ($83,798, a difference of 0.12%), Puget Sound Salish ($84,011, a difference of 0.13%), Belgian ($84,008, a difference of 0.13%), and Iraqi ($83,753, a difference of 0.18%).
| Demographics | Rating | Rank | Median Household Income |
| Uruguayans | 43.5 /100 | #182 | Average $84,691 |
| Spaniards | 42.7 /100 | #183 | Average $84,644 |
| Immigrants | Eastern Africa | 37.4 /100 | #184 | Fair $84,299 |
| Kenyans | 34.2 /100 | #185 | Fair $84,085 |
| Puget Sound Salish | 33.2 /100 | #186 | Fair $84,011 |
| Belgians | 33.2 /100 | #187 | Fair $84,008 |
| Tlingit-Haida | 32.6 /100 | #188 | Fair $83,968 |
| Immigrants | Colombia | 31.7 /100 | #189 | Fair $83,902 |
| Slovaks | 30.2 /100 | #190 | Fair $83,798 |
| Iraqis | 29.6 /100 | #191 | Fair $83,753 |
| Welsh | 28.0 /100 | #192 | Fair $83,628 |
| Finns | 27.7 /100 | #193 | Fair $83,607 |
| Ghanaians | 27.4 /100 | #194 | Fair $83,582 |
| Immigrants | Armenia | 27.0 /100 | #195 | Fair $83,555 |
| French | 26.0 /100 | #196 | Fair $83,468 |
Demographics Similar to Assyrians/Chaldeans/Syriacs by Median Household Income
In terms of median household income, the demographic groups most similar to Assyrians/Chaldeans/Syriacs are Romanian ($91,994, a difference of 0.0%), Immigrants from Vietnam ($91,987, a difference of 0.0%), Immigrants from Canada ($92,029, a difference of 0.040%), Immigrants from Western Europe ($91,936, a difference of 0.060%), and Immigrants from Hungary ($92,094, a difference of 0.11%).
| Demographics | Rating | Rank | Median Household Income |
| Italians | 99.1 /100 | #83 | Exceptional $92,475 |
| Immigrants | Argentina | 99.1 /100 | #84 | Exceptional $92,417 |
| Immigrants | Croatia | 99.0 /100 | #85 | Exceptional $92,225 |
| Immigrants | England | 98.9 /100 | #86 | Exceptional $92,098 |
| Immigrants | Hungary | 98.9 /100 | #87 | Exceptional $92,094 |
| Immigrants | Canada | 98.8 /100 | #88 | Exceptional $92,029 |
| Romanians | 98.8 /100 | #89 | Exceptional $91,994 |
| Assyrians/Chaldeans/Syriacs | 98.8 /100 | #90 | Exceptional $91,991 |
| Immigrants | Vietnam | 98.8 /100 | #91 | Exceptional $91,987 |
| Immigrants | Western Europe | 98.8 /100 | #92 | Exceptional $91,936 |
| Immigrants | Lebanon | 98.7 /100 | #93 | Exceptional $91,887 |
| Immigrants | North America | 98.7 /100 | #94 | Exceptional $91,860 |
| Armenians | 98.7 /100 | #95 | Exceptional $91,807 |
| Jordanians | 98.7 /100 | #96 | Exceptional $91,794 |
| Immigrants | Serbia | 98.6 /100 | #97 | Exceptional $91,730 |