Comanche vs Costa Rican Bachelor's Degree
COMPARE
Comanche
Costa Rican
Bachelor's Degree
Bachelor's Degree Comparison
Comanche
Costa Ricans
31.9%
BACHELOR'S DEGREE
0.2/ 100
METRIC RATING
272nd/ 347
METRIC RANK
37.7%
BACHELOR'S DEGREE
47.6/ 100
METRIC RATING
176th/ 347
METRIC RANK
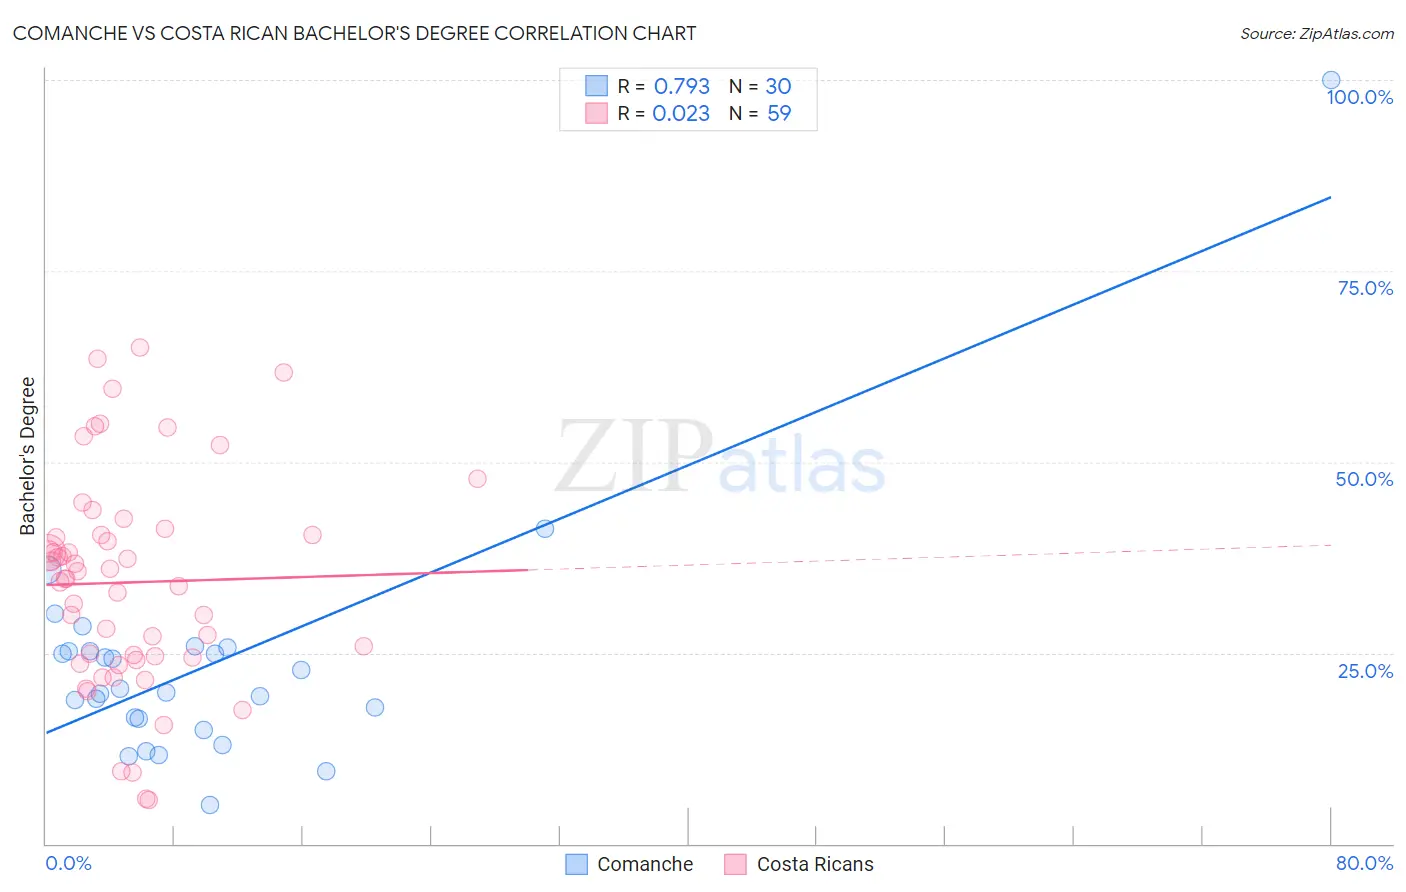
Comanche vs Costa Rican Bachelor's Degree Correlation Chart
The statistical analysis conducted on geographies consisting of 109,781,211 people shows a strong positive correlation between the proportion of Comanche and percentage of population with at least bachelor's degree education in the United States with a correlation coefficient (R) of 0.793 and weighted average of 31.9%. Similarly, the statistical analysis conducted on geographies consisting of 253,595,641 people shows no correlation between the proportion of Costa Ricans and percentage of population with at least bachelor's degree education in the United States with a correlation coefficient (R) of 0.023 and weighted average of 37.7%, a difference of 18.3%.
Bachelor's Degree Correlation Summary
| Measurement | Comanche | Costa Rican |
| Minimum | 5.1% | 5.7% |
| Maximum | 100.0% | 65.0% |
| Range | 94.9% | 59.3% |
| Mean | 23.5% | 34.2% |
| Median | 20.1% | 34.8% |
| Interquartile 25% (IQ1) | 16.4% | 24.5% |
| Interquartile 75% (IQ3) | 25.1% | 40.5% |
| Interquartile Range (IQR) | 8.7% | 16.0% |
| Standard Deviation (Sample) | 16.4% | 13.9% |
| Standard Deviation (Population) | 16.1% | 13.8% |
Similar Demographics by Bachelor's Degree
Demographics Similar to Comanche by Bachelor's Degree
In terms of bachelor's degree, the demographic groups most similar to Comanche are Central American (31.9%, a difference of 0.030%), Immigrants from Nicaragua (31.9%, a difference of 0.12%), American (31.9%, a difference of 0.12%), Potawatomi (31.9%, a difference of 0.14%), and Samoan (31.8%, a difference of 0.27%).
| Demographics | Rating | Rank | Bachelor's Degree |
| Bahamians | 0.3 /100 | #265 | Tragic 32.5% |
| Immigrants | Dominica | 0.3 /100 | #266 | Tragic 32.5% |
| Cubans | 0.3 /100 | #267 | Tragic 32.5% |
| Immigrants | Portugal | 0.2 /100 | #268 | Tragic 32.2% |
| Immigrants | Belize | 0.2 /100 | #269 | Tragic 32.1% |
| Immigrants | Nicaragua | 0.2 /100 | #270 | Tragic 31.9% |
| Central Americans | 0.2 /100 | #271 | Tragic 31.9% |
| Comanche | 0.2 /100 | #272 | Tragic 31.9% |
| Americans | 0.2 /100 | #273 | Tragic 31.9% |
| Potawatomi | 0.2 /100 | #274 | Tragic 31.9% |
| Samoans | 0.1 /100 | #275 | Tragic 31.8% |
| Salvadorans | 0.1 /100 | #276 | Tragic 31.8% |
| Dominicans | 0.1 /100 | #277 | Tragic 31.8% |
| Marshallese | 0.1 /100 | #278 | Tragic 31.7% |
| Hawaiians | 0.1 /100 | #279 | Tragic 31.6% |
Demographics Similar to Costa Ricans by Bachelor's Degree
In terms of bachelor's degree, the demographic groups most similar to Costa Ricans are Basque (37.7%, a difference of 0.020%), Immigrants from Uruguay (37.8%, a difference of 0.080%), Immigrants from Cameroon (37.7%, a difference of 0.080%), Immigrants from Colombia (37.7%, a difference of 0.21%), and Immigrants from Bangladesh (37.8%, a difference of 0.24%).
| Demographics | Rating | Rank | Bachelor's Degree |
| Ghanaians | 55.3 /100 | #169 | Average 38.0% |
| Czechs | 54.4 /100 | #170 | Average 38.0% |
| Bermudans | 54.2 /100 | #171 | Average 38.0% |
| Immigrants | Somalia | 52.8 /100 | #172 | Average 37.9% |
| Immigrants | Iraq | 52.5 /100 | #173 | Average 37.9% |
| Immigrants | Bangladesh | 50.0 /100 | #174 | Average 37.8% |
| Immigrants | Uruguay | 48.3 /100 | #175 | Average 37.8% |
| Costa Ricans | 47.6 /100 | #176 | Average 37.7% |
| Basques | 47.4 /100 | #177 | Average 37.7% |
| Immigrants | Cameroon | 46.8 /100 | #178 | Average 37.7% |
| Immigrants | Colombia | 45.4 /100 | #179 | Average 37.7% |
| Irish | 44.3 /100 | #180 | Average 37.6% |
| Immigrants | Senegal | 43.8 /100 | #181 | Average 37.6% |
| Immigrants | Bosnia and Herzegovina | 43.4 /100 | #182 | Average 37.6% |
| Senegalese | 42.2 /100 | #183 | Average 37.5% |