Comanche vs Spaniard Per Capita Income
COMPARE
Comanche
Spaniard
Per Capita Income
Per Capita Income Comparison
Comanche
Spaniards
$38,088
PER CAPITA INCOME
0.2/ 100
METRIC RATING
277th/ 347
METRIC RANK
$43,028
PER CAPITA INCOME
32.9/ 100
METRIC RATING
184th/ 347
METRIC RANK
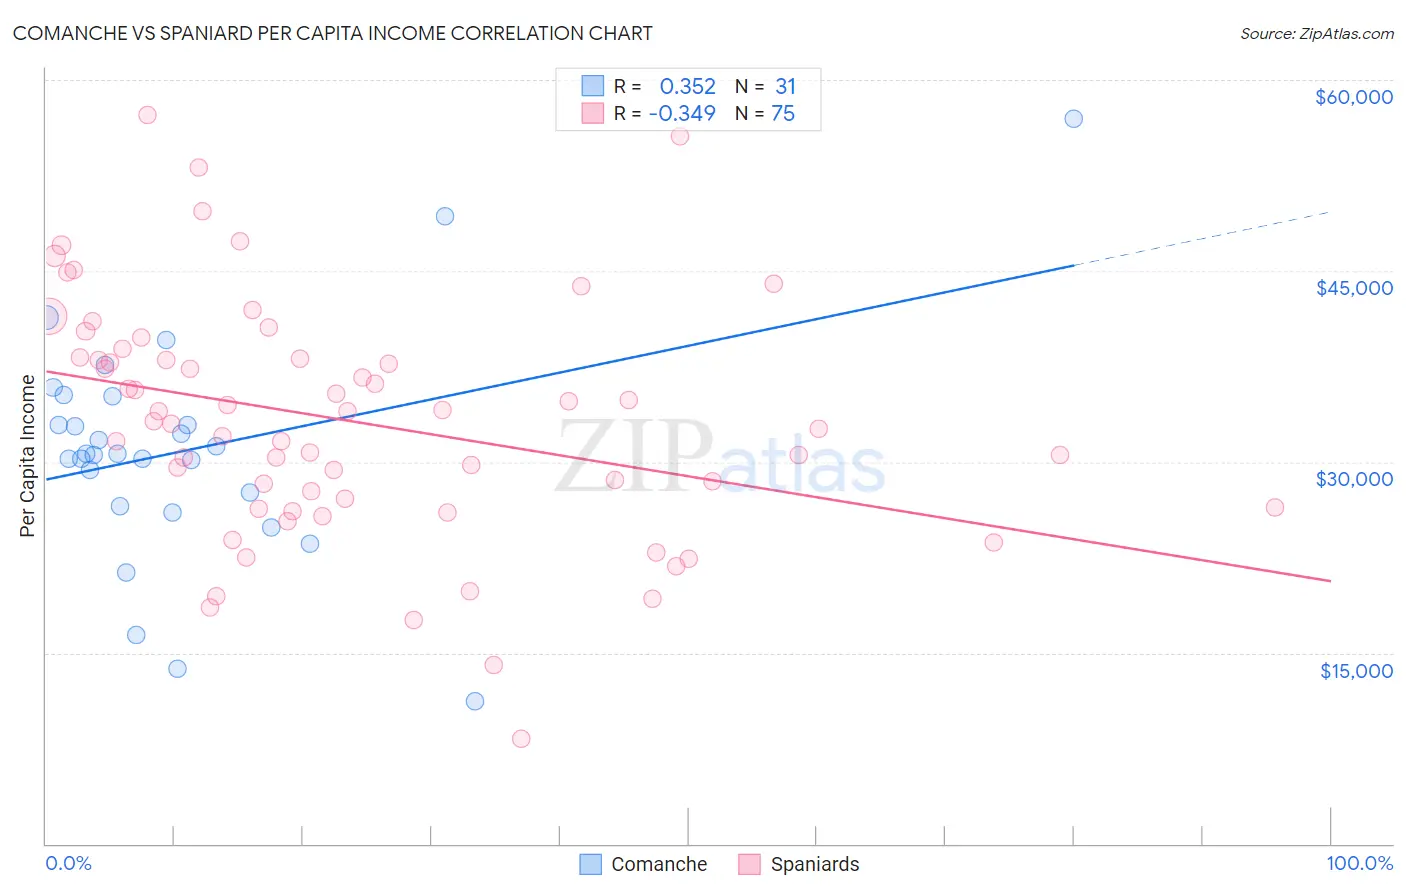
Comanche vs Spaniard Per Capita Income Correlation Chart
The statistical analysis conducted on geographies consisting of 109,786,530 people shows a mild positive correlation between the proportion of Comanche and per capita income in the United States with a correlation coefficient (R) of 0.352 and weighted average of $38,088. Similarly, the statistical analysis conducted on geographies consisting of 443,584,156 people shows a mild negative correlation between the proportion of Spaniards and per capita income in the United States with a correlation coefficient (R) of -0.349 and weighted average of $43,028, a difference of 13.0%.
Per Capita Income Correlation Summary
| Measurement | Comanche | Spaniard |
| Minimum | $11,178 | $8,290 |
| Maximum | $56,980 | $57,272 |
| Range | $45,802 | $48,982 |
| Mean | $30,910 | $33,214 |
| Median | $30,680 | $33,192 |
| Interquartile 25% (IQ1) | $26,547 | $26,374 |
| Interquartile 75% (IQ3) | $35,132 | $38,222 |
| Interquartile Range (IQR) | $8,585 | $11,848 |
| Standard Deviation (Sample) | $9,053 | $9,446 |
| Standard Deviation (Population) | $8,906 | $9,383 |
Similar Demographics by Per Capita Income
Demographics Similar to Comanche by Per Capita Income
In terms of per capita income, the demographic groups most similar to Comanche are Immigrants from Nicaragua ($38,065, a difference of 0.060%), Hmong ($38,120, a difference of 0.080%), Colville ($38,047, a difference of 0.11%), Potawatomi ($38,046, a difference of 0.11%), and Immigrants from Liberia ($38,165, a difference of 0.20%).
| Demographics | Rating | Rank | Per Capita Income |
| Immigrants | Belize | 0.3 /100 | #270 | Tragic $38,614 |
| Central Americans | 0.3 /100 | #271 | Tragic $38,560 |
| Immigrants | Cabo Verde | 0.3 /100 | #272 | Tragic $38,540 |
| Nepalese | 0.3 /100 | #273 | Tragic $38,442 |
| Immigrants | El Salvador | 0.3 /100 | #274 | Tragic $38,394 |
| Immigrants | Liberia | 0.2 /100 | #275 | Tragic $38,165 |
| Hmong | 0.2 /100 | #276 | Tragic $38,120 |
| Comanche | 0.2 /100 | #277 | Tragic $38,088 |
| Immigrants | Nicaragua | 0.2 /100 | #278 | Tragic $38,065 |
| Colville | 0.2 /100 | #279 | Tragic $38,047 |
| Potawatomi | 0.2 /100 | #280 | Tragic $38,046 |
| Immigrants | Dominica | 0.2 /100 | #281 | Tragic $37,952 |
| Immigrants | Laos | 0.1 /100 | #282 | Tragic $37,857 |
| Pennsylvania Germans | 0.1 /100 | #283 | Tragic $37,842 |
| Africans | 0.1 /100 | #284 | Tragic $37,785 |
Demographics Similar to Spaniards by Per Capita Income
In terms of per capita income, the demographic groups most similar to Spaniards are Immigrants ($43,010, a difference of 0.040%), French Canadian ($43,003, a difference of 0.060%), German ($43,067, a difference of 0.090%), Immigrants from Colombia ($42,971, a difference of 0.13%), and Immigrants from Africa ($42,950, a difference of 0.18%).
| Demographics | Rating | Rank | Per Capita Income |
| Tlingit-Haida | 45.9 /100 | #177 | Average $43,516 |
| Immigrants | Costa Rica | 44.5 /100 | #178 | Average $43,464 |
| Finns | 44.4 /100 | #179 | Average $43,461 |
| Sierra Leoneans | 42.9 /100 | #180 | Average $43,405 |
| Welsh | 38.2 /100 | #181 | Fair $43,233 |
| Immigrants | Vietnam | 38.1 /100 | #182 | Fair $43,229 |
| Germans | 33.9 /100 | #183 | Fair $43,067 |
| Spaniards | 32.9 /100 | #184 | Fair $43,028 |
| Immigrants | Immigrants | 32.5 /100 | #185 | Fair $43,010 |
| French Canadians | 32.3 /100 | #186 | Fair $43,003 |
| Immigrants | Colombia | 31.5 /100 | #187 | Fair $42,971 |
| Immigrants | Africa | 31.0 /100 | #188 | Fair $42,950 |
| Bermudans | 30.1 /100 | #189 | Fair $42,911 |
| Kenyans | 27.7 /100 | #190 | Fair $42,808 |
| Yugoslavians | 27.4 /100 | #191 | Fair $42,792 |