Colville vs Tsimshian Median Household Income
COMPARE
Colville
Tsimshian
Median Household Income
Median Household Income Comparison
Colville
Tsimshian
$70,094
MEDIAN HOUSEHOLD INCOME
0.0/ 100
METRIC RATING
320th/ 347
METRIC RANK
$83,346
MEDIAN HOUSEHOLD INCOME
24.5/ 100
METRIC RATING
200th/ 347
METRIC RANK
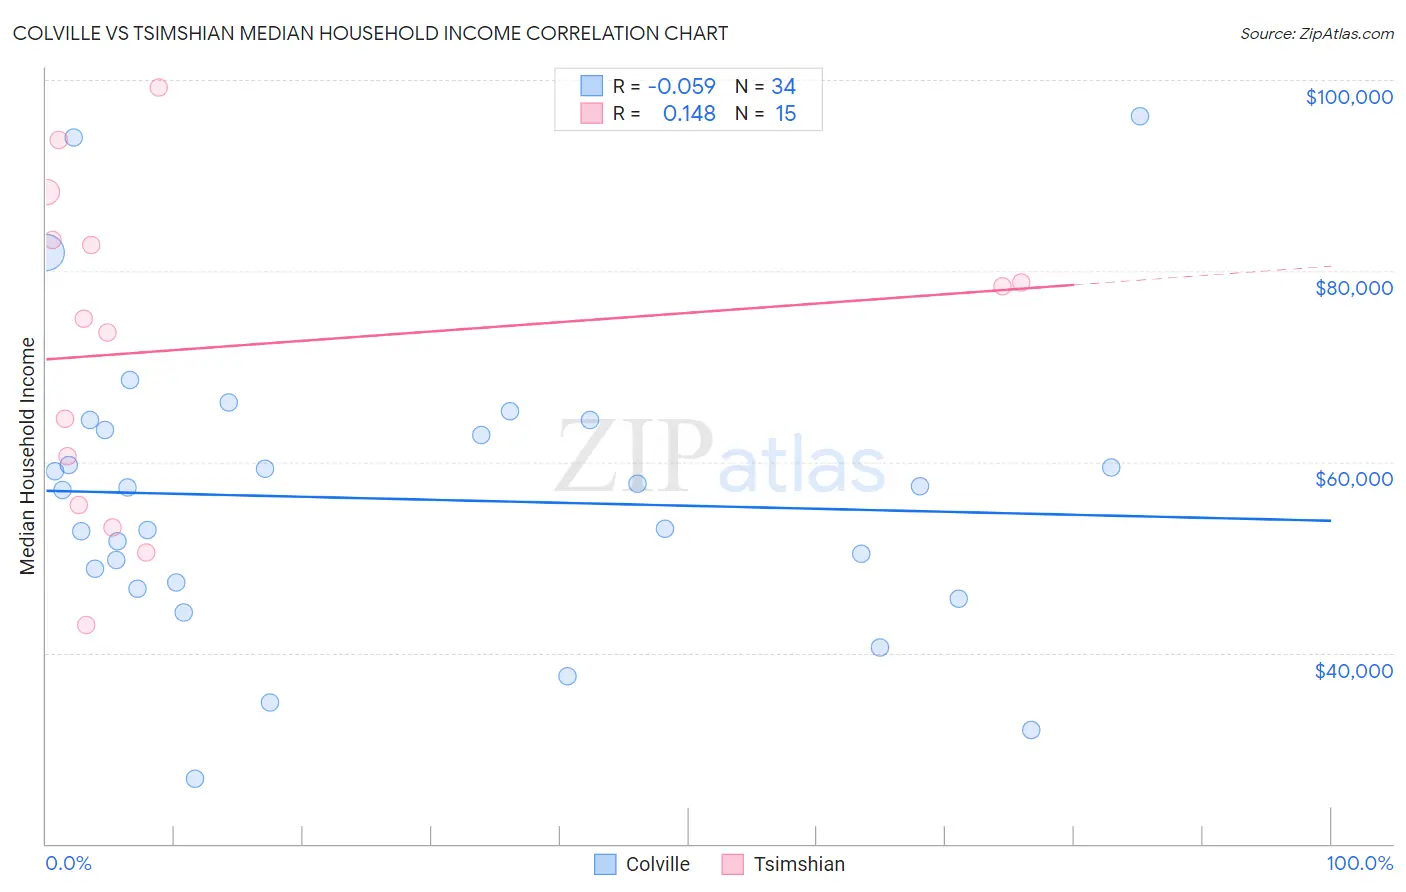
Colville vs Tsimshian Median Household Income Correlation Chart
The statistical analysis conducted on geographies consisting of 34,681,598 people shows a slight negative correlation between the proportion of Colville and median household income in the United States with a correlation coefficient (R) of -0.059 and weighted average of $70,094. Similarly, the statistical analysis conducted on geographies consisting of 15,626,462 people shows a poor positive correlation between the proportion of Tsimshian and median household income in the United States with a correlation coefficient (R) of 0.148 and weighted average of $83,346, a difference of 18.9%.
Median Household Income Correlation Summary
| Measurement | Colville | Tsimshian |
| Minimum | $26,823 | $42,857 |
| Maximum | $96,250 | $99,167 |
| Range | $69,427 | $56,310 |
| Mean | $56,145 | $71,994 |
| Median | $57,218 | $75,000 |
| Interquartile 25% (IQ1) | $47,361 | $55,448 |
| Interquartile 75% (IQ3) | $63,313 | $83,217 |
| Interquartile Range (IQR) | $15,952 | $27,769 |
| Standard Deviation (Sample) | $14,989 | $16,777 |
| Standard Deviation (Population) | $14,767 | $16,208 |
Similar Demographics by Median Household Income
Demographics Similar to Colville by Median Household Income
In terms of median household income, the demographic groups most similar to Colville are Chickasaw ($70,005, a difference of 0.13%), Immigrants from Dominican Republic ($70,208, a difference of 0.16%), Choctaw ($69,947, a difference of 0.21%), Bahamian ($69,726, a difference of 0.53%), and Yup'ik ($69,695, a difference of 0.57%).
| Demographics | Rating | Rank | Median Household Income |
| Immigrants | Bahamas | 0.0 /100 | #313 | Tragic $71,349 |
| Dominicans | 0.0 /100 | #314 | Tragic $71,302 |
| Ottawa | 0.0 /100 | #315 | Tragic $70,984 |
| Apache | 0.0 /100 | #316 | Tragic $70,927 |
| Cajuns | 0.0 /100 | #317 | Tragic $70,605 |
| Chippewa | 0.0 /100 | #318 | Tragic $70,539 |
| Immigrants | Dominican Republic | 0.0 /100 | #319 | Tragic $70,208 |
| Colville | 0.0 /100 | #320 | Tragic $70,094 |
| Chickasaw | 0.0 /100 | #321 | Tragic $70,005 |
| Choctaw | 0.0 /100 | #322 | Tragic $69,947 |
| Bahamians | 0.0 /100 | #323 | Tragic $69,726 |
| Yup'ik | 0.0 /100 | #324 | Tragic $69,695 |
| Seminole | 0.0 /100 | #325 | Tragic $69,420 |
| Yuman | 0.0 /100 | #326 | Tragic $68,743 |
| Immigrants | Cuba | 0.0 /100 | #327 | Tragic $68,461 |
Demographics Similar to Tsimshian by Median Household Income
In terms of median household income, the demographic groups most similar to Tsimshian are Spanish ($83,343, a difference of 0.0%), German ($83,358, a difference of 0.010%), Immigrants from Thailand ($83,327, a difference of 0.020%), Immigrants from Cambodia ($83,304, a difference of 0.050%), and Japanese ($83,395, a difference of 0.060%).
| Demographics | Rating | Rank | Median Household Income |
| Finns | 27.7 /100 | #193 | Fair $83,607 |
| Ghanaians | 27.4 /100 | #194 | Fair $83,582 |
| Immigrants | Armenia | 27.0 /100 | #195 | Fair $83,555 |
| French | 26.0 /100 | #196 | Fair $83,468 |
| Aleuts | 25.7 /100 | #197 | Fair $83,446 |
| Japanese | 25.1 /100 | #198 | Fair $83,395 |
| Germans | 24.6 /100 | #199 | Fair $83,358 |
| Tsimshian | 24.5 /100 | #200 | Fair $83,346 |
| Spanish | 24.4 /100 | #201 | Fair $83,343 |
| Immigrants | Thailand | 24.3 /100 | #202 | Fair $83,327 |
| Immigrants | Cambodia | 24.0 /100 | #203 | Fair $83,304 |
| Immigrants | Africa | 23.8 /100 | #204 | Fair $83,289 |
| Celtics | 22.7 /100 | #205 | Fair $83,193 |
| Immigrants | Kenya | 21.3 /100 | #206 | Fair $83,068 |
| Dutch | 20.3 /100 | #207 | Fair $82,971 |