Colville vs Portuguese Median Household Income
COMPARE
Colville
Portuguese
Median Household Income
Median Household Income Comparison
Colville
Portuguese
$70,094
MEDIAN HOUSEHOLD INCOME
0.0/ 100
METRIC RATING
320th/ 347
METRIC RANK
$88,976
MEDIAN HOUSEHOLD INCOME
92.3/ 100
METRIC RATING
128th/ 347
METRIC RANK
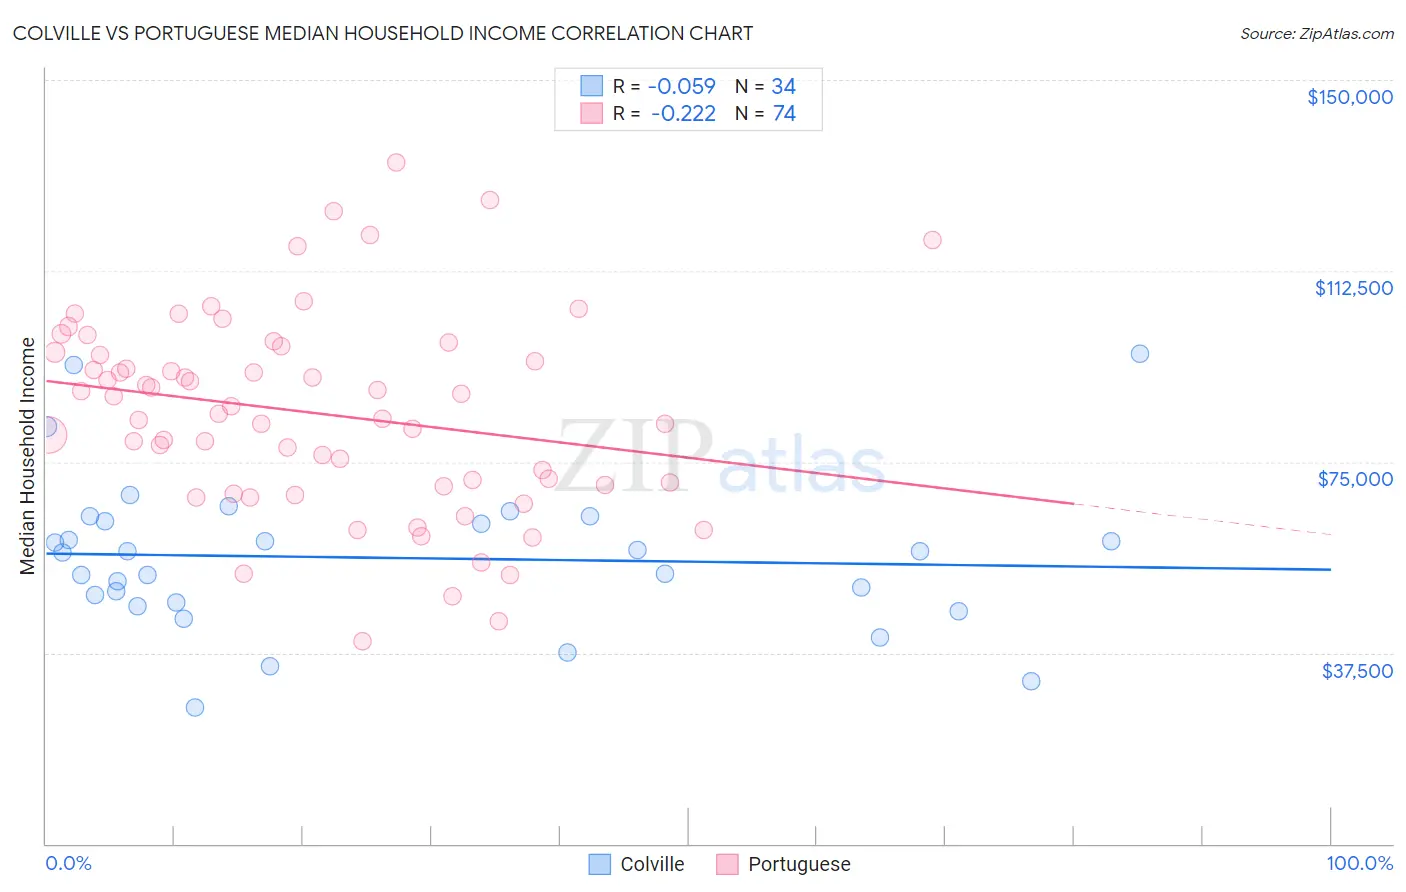
Colville vs Portuguese Median Household Income Correlation Chart
The statistical analysis conducted on geographies consisting of 34,681,598 people shows a slight negative correlation between the proportion of Colville and median household income in the United States with a correlation coefficient (R) of -0.059 and weighted average of $70,094. Similarly, the statistical analysis conducted on geographies consisting of 449,847,647 people shows a weak negative correlation between the proportion of Portuguese and median household income in the United States with a correlation coefficient (R) of -0.222 and weighted average of $88,976, a difference of 26.9%.
Median Household Income Correlation Summary
| Measurement | Colville | Portuguese |
| Minimum | $26,823 | $39,715 |
| Maximum | $96,250 | $133,721 |
| Range | $69,427 | $94,006 |
| Mean | $56,145 | $84,548 |
| Median | $57,218 | $85,247 |
| Interquartile 25% (IQ1) | $47,361 | $70,338 |
| Interquartile 75% (IQ3) | $63,313 | $96,551 |
| Interquartile Range (IQR) | $15,952 | $26,213 |
| Standard Deviation (Sample) | $14,989 | $19,508 |
| Standard Deviation (Population) | $14,767 | $19,376 |
Similar Demographics by Median Household Income
Demographics Similar to Colville by Median Household Income
In terms of median household income, the demographic groups most similar to Colville are Chickasaw ($70,005, a difference of 0.13%), Immigrants from Dominican Republic ($70,208, a difference of 0.16%), Choctaw ($69,947, a difference of 0.21%), Bahamian ($69,726, a difference of 0.53%), and Yup'ik ($69,695, a difference of 0.57%).
| Demographics | Rating | Rank | Median Household Income |
| Immigrants | Bahamas | 0.0 /100 | #313 | Tragic $71,349 |
| Dominicans | 0.0 /100 | #314 | Tragic $71,302 |
| Ottawa | 0.0 /100 | #315 | Tragic $70,984 |
| Apache | 0.0 /100 | #316 | Tragic $70,927 |
| Cajuns | 0.0 /100 | #317 | Tragic $70,605 |
| Chippewa | 0.0 /100 | #318 | Tragic $70,539 |
| Immigrants | Dominican Republic | 0.0 /100 | #319 | Tragic $70,208 |
| Colville | 0.0 /100 | #320 | Tragic $70,094 |
| Chickasaw | 0.0 /100 | #321 | Tragic $70,005 |
| Choctaw | 0.0 /100 | #322 | Tragic $69,947 |
| Bahamians | 0.0 /100 | #323 | Tragic $69,726 |
| Yup'ik | 0.0 /100 | #324 | Tragic $69,695 |
| Seminole | 0.0 /100 | #325 | Tragic $69,420 |
| Yuman | 0.0 /100 | #326 | Tragic $68,743 |
| Immigrants | Cuba | 0.0 /100 | #327 | Tragic $68,461 |
Demographics Similar to Portuguese by Median Household Income
In terms of median household income, the demographic groups most similar to Portuguese are Immigrants from Peru ($89,010, a difference of 0.040%), Brazilian ($88,934, a difference of 0.050%), British ($88,914, a difference of 0.070%), Immigrants from Oceania ($89,100, a difference of 0.14%), and Immigrants from Syria ($88,792, a difference of 0.21%).
| Demographics | Rating | Rank | Median Household Income |
| Ethiopians | 94.9 /100 | #121 | Exceptional $89,640 |
| Pakistanis | 94.8 /100 | #122 | Exceptional $89,638 |
| Immigrants | Zimbabwe | 94.4 /100 | #123 | Exceptional $89,496 |
| Immigrants | Jordan | 94.1 /100 | #124 | Exceptional $89,412 |
| Immigrants | Kuwait | 93.5 /100 | #125 | Exceptional $89,263 |
| Immigrants | Oceania | 92.9 /100 | #126 | Exceptional $89,100 |
| Immigrants | Peru | 92.5 /100 | #127 | Exceptional $89,010 |
| Portuguese | 92.3 /100 | #128 | Exceptional $88,976 |
| Brazilians | 92.1 /100 | #129 | Exceptional $88,934 |
| British | 92.0 /100 | #130 | Exceptional $88,914 |
| Immigrants | Syria | 91.4 /100 | #131 | Exceptional $88,792 |
| Europeans | 91.2 /100 | #132 | Exceptional $88,751 |
| Immigrants | Ethiopia | 90.9 /100 | #133 | Exceptional $88,687 |
| Swedes | 90.0 /100 | #134 | Exceptional $88,524 |
| Immigrants | Sierra Leone | 89.9 /100 | #135 | Excellent $88,498 |