Colville vs Central American Indian Median Household Income
COMPARE
Colville
Central American Indian
Median Household Income
Median Household Income Comparison
Colville
Central American Indians
$70,094
MEDIAN HOUSEHOLD INCOME
0.0/ 100
METRIC RATING
320th/ 347
METRIC RANK
$74,847
MEDIAN HOUSEHOLD INCOME
0.1/ 100
METRIC RATING
282nd/ 347
METRIC RANK
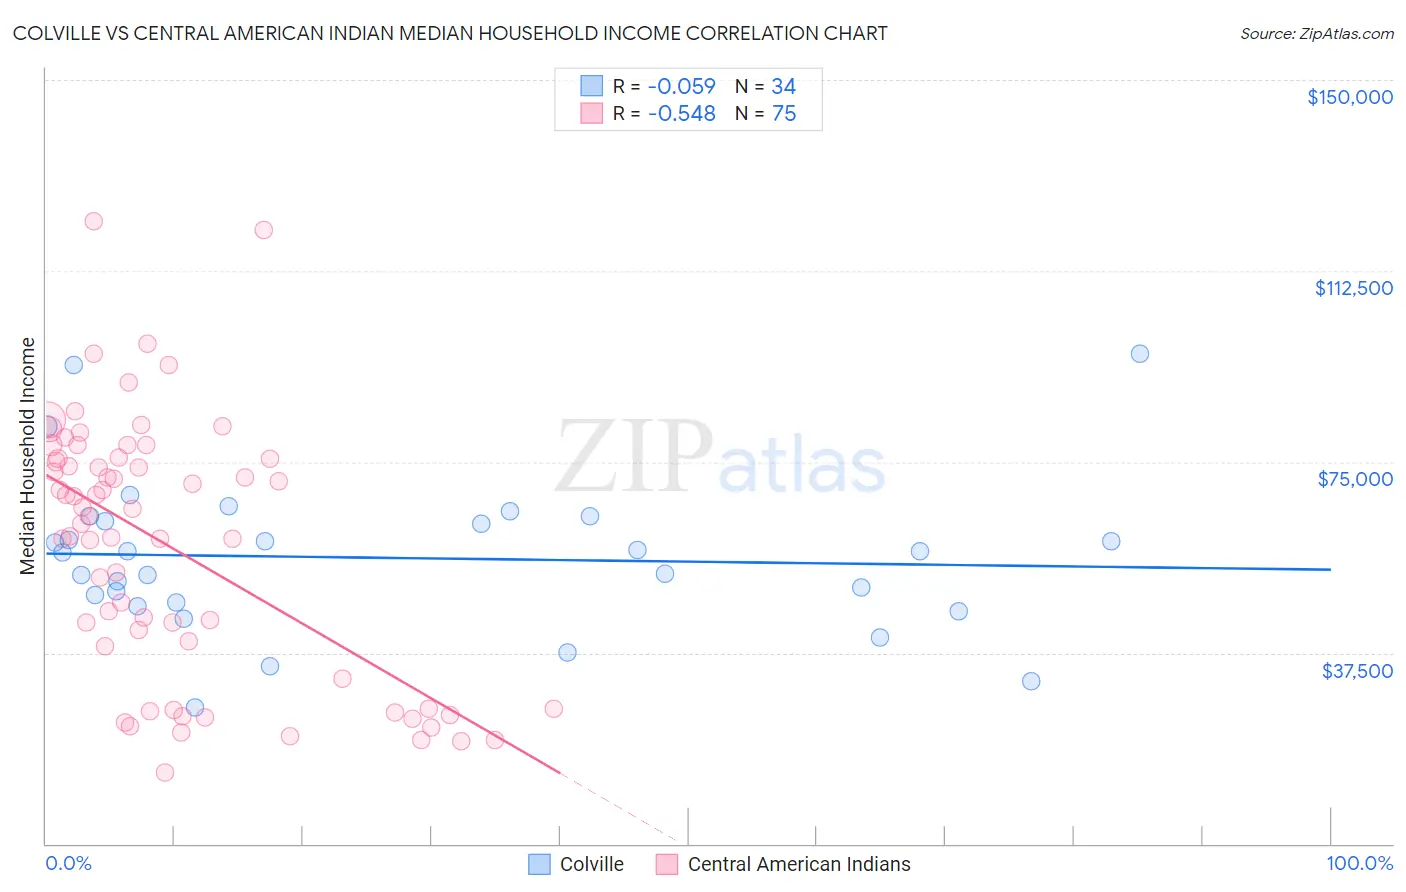
Colville vs Central American Indian Median Household Income Correlation Chart
The statistical analysis conducted on geographies consisting of 34,681,598 people shows a slight negative correlation between the proportion of Colville and median household income in the United States with a correlation coefficient (R) of -0.059 and weighted average of $70,094. Similarly, the statistical analysis conducted on geographies consisting of 326,011,842 people shows a substantial negative correlation between the proportion of Central American Indians and median household income in the United States with a correlation coefficient (R) of -0.548 and weighted average of $74,847, a difference of 6.8%.
Median Household Income Correlation Summary
| Measurement | Colville | Central American Indian |
| Minimum | $26,823 | $14,073 |
| Maximum | $96,250 | $122,237 |
| Range | $69,427 | $108,164 |
| Mean | $56,145 | $58,298 |
| Median | $57,218 | $64,310 |
| Interquartile 25% (IQ1) | $47,361 | $32,456 |
| Interquartile 75% (IQ3) | $63,313 | $75,688 |
| Interquartile Range (IQR) | $15,952 | $43,232 |
| Standard Deviation (Sample) | $14,989 | $25,417 |
| Standard Deviation (Population) | $14,767 | $25,247 |
Similar Demographics by Median Household Income
Demographics Similar to Colville by Median Household Income
In terms of median household income, the demographic groups most similar to Colville are Chickasaw ($70,005, a difference of 0.13%), Immigrants from Dominican Republic ($70,208, a difference of 0.16%), Choctaw ($69,947, a difference of 0.21%), Bahamian ($69,726, a difference of 0.53%), and Yup'ik ($69,695, a difference of 0.57%).
| Demographics | Rating | Rank | Median Household Income |
| Immigrants | Bahamas | 0.0 /100 | #313 | Tragic $71,349 |
| Dominicans | 0.0 /100 | #314 | Tragic $71,302 |
| Ottawa | 0.0 /100 | #315 | Tragic $70,984 |
| Apache | 0.0 /100 | #316 | Tragic $70,927 |
| Cajuns | 0.0 /100 | #317 | Tragic $70,605 |
| Chippewa | 0.0 /100 | #318 | Tragic $70,539 |
| Immigrants | Dominican Republic | 0.0 /100 | #319 | Tragic $70,208 |
| Colville | 0.0 /100 | #320 | Tragic $70,094 |
| Chickasaw | 0.0 /100 | #321 | Tragic $70,005 |
| Choctaw | 0.0 /100 | #322 | Tragic $69,947 |
| Bahamians | 0.0 /100 | #323 | Tragic $69,726 |
| Yup'ik | 0.0 /100 | #324 | Tragic $69,695 |
| Seminole | 0.0 /100 | #325 | Tragic $69,420 |
| Yuman | 0.0 /100 | #326 | Tragic $68,743 |
| Immigrants | Cuba | 0.0 /100 | #327 | Tragic $68,461 |
Demographics Similar to Central American Indians by Median Household Income
In terms of median household income, the demographic groups most similar to Central American Indians are Immigrants from Liberia ($74,896, a difference of 0.070%), Senegalese ($74,999, a difference of 0.20%), Cree ($74,685, a difference of 0.22%), Yaqui ($74,596, a difference of 0.34%), and Immigrants from Guatemala ($75,123, a difference of 0.37%).
| Demographics | Rating | Rank | Median Household Income |
| Immigrants | Micronesia | 0.2 /100 | #275 | Tragic $75,574 |
| Immigrants | Latin America | 0.2 /100 | #276 | Tragic $75,420 |
| Spanish Americans | 0.2 /100 | #277 | Tragic $75,386 |
| Osage | 0.2 /100 | #278 | Tragic $75,240 |
| Immigrants | Guatemala | 0.2 /100 | #279 | Tragic $75,123 |
| Senegalese | 0.2 /100 | #280 | Tragic $74,999 |
| Immigrants | Liberia | 0.1 /100 | #281 | Tragic $74,896 |
| Central American Indians | 0.1 /100 | #282 | Tragic $74,847 |
| Cree | 0.1 /100 | #283 | Tragic $74,685 |
| Yaqui | 0.1 /100 | #284 | Tragic $74,596 |
| Mexicans | 0.1 /100 | #285 | Tragic $74,399 |
| Immigrants | Somalia | 0.1 /100 | #286 | Tragic $74,300 |
| Iroquois | 0.1 /100 | #287 | Tragic $74,279 |
| Immigrants | Central America | 0.1 /100 | #288 | Tragic $74,217 |
| Fijians | 0.1 /100 | #289 | Tragic $74,205 |