Colville vs Hopi Median Household Income
COMPARE
Colville
Hopi
Median Household Income
Median Household Income Comparison
Colville
Hopi
$70,094
MEDIAN HOUSEHOLD INCOME
0.0/ 100
METRIC RATING
320th/ 347
METRIC RANK
$65,043
MEDIAN HOUSEHOLD INCOME
0.0/ 100
METRIC RATING
339th/ 347
METRIC RANK
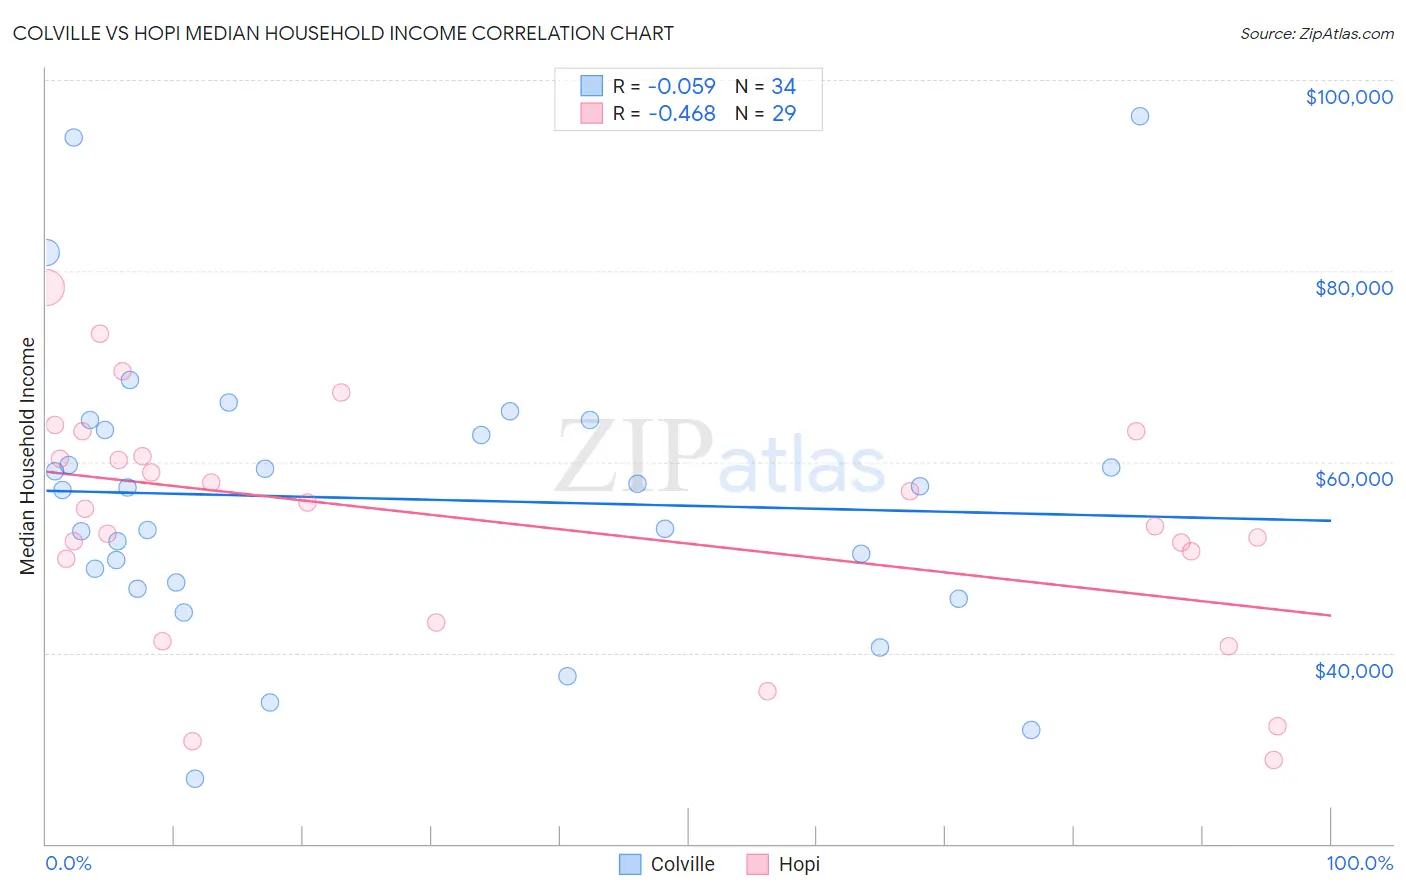
Colville vs Hopi Median Household Income Correlation Chart
The statistical analysis conducted on geographies consisting of 34,681,598 people shows a slight negative correlation between the proportion of Colville and median household income in the United States with a correlation coefficient (R) of -0.059 and weighted average of $70,094. Similarly, the statistical analysis conducted on geographies consisting of 74,731,446 people shows a moderate negative correlation between the proportion of Hopi and median household income in the United States with a correlation coefficient (R) of -0.468 and weighted average of $65,043, a difference of 7.8%.
Median Household Income Correlation Summary
| Measurement | Colville | Hopi |
| Minimum | $26,823 | $28,831 |
| Maximum | $96,250 | $78,310 |
| Range | $69,427 | $49,479 |
| Mean | $56,145 | $53,752 |
| Median | $57,218 | $55,122 |
| Interquartile 25% (IQ1) | $47,361 | $46,511 |
| Interquartile 75% (IQ3) | $63,313 | $61,881 |
| Interquartile Range (IQR) | $15,952 | $15,370 |
| Standard Deviation (Sample) | $14,989 | $12,388 |
| Standard Deviation (Population) | $14,767 | $12,173 |
Demographics Similar to Colville and Hopi by Median Household Income
In terms of median household income, the demographic groups most similar to Colville are Chickasaw ($70,005, a difference of 0.13%), Immigrants from Dominican Republic ($70,208, a difference of 0.16%), Choctaw ($69,947, a difference of 0.21%), Bahamian ($69,726, a difference of 0.53%), and Yup'ik ($69,695, a difference of 0.57%). Similarly, the demographic groups most similar to Hopi are Immigrants from Yemen ($65,194, a difference of 0.23%), Kiowa ($65,914, a difference of 1.3%), Immigrants from Congo ($66,768, a difference of 2.6%), Cheyenne ($66,974, a difference of 3.0%), and Black/African American ($67,573, a difference of 3.9%).
| Demographics | Rating | Rank | Median Household Income |
| Immigrants | Dominican Republic | 0.0 /100 | #319 | Tragic $70,208 |
| Colville | 0.0 /100 | #320 | Tragic $70,094 |
| Chickasaw | 0.0 /100 | #321 | Tragic $70,005 |
| Choctaw | 0.0 /100 | #322 | Tragic $69,947 |
| Bahamians | 0.0 /100 | #323 | Tragic $69,726 |
| Yup'ik | 0.0 /100 | #324 | Tragic $69,695 |
| Seminole | 0.0 /100 | #325 | Tragic $69,420 |
| Yuman | 0.0 /100 | #326 | Tragic $68,743 |
| Immigrants | Cuba | 0.0 /100 | #327 | Tragic $68,461 |
| Menominee | 0.0 /100 | #328 | Tragic $68,423 |
| Dutch West Indians | 0.0 /100 | #329 | Tragic $68,412 |
| Arapaho | 0.0 /100 | #330 | Tragic $67,965 |
| Natives/Alaskans | 0.0 /100 | #331 | Tragic $67,879 |
| Sioux | 0.0 /100 | #332 | Tragic $67,792 |
| Creek | 0.0 /100 | #333 | Tragic $67,715 |
| Blacks/African Americans | 0.0 /100 | #334 | Tragic $67,573 |
| Cheyenne | 0.0 /100 | #335 | Tragic $66,974 |
| Immigrants | Congo | 0.0 /100 | #336 | Tragic $66,768 |
| Kiowa | 0.0 /100 | #337 | Tragic $65,914 |
| Immigrants | Yemen | 0.0 /100 | #338 | Tragic $65,194 |
| Hopi | 0.0 /100 | #339 | Tragic $65,043 |