Colville vs Maltese Householder Income Ages 45 - 64 years
COMPARE
Colville
Maltese
Householder Income Ages 45 - 64 years
Householder Income Ages 45 - 64 years Comparison
Colville
Maltese
$82,474
HOUSEHOLDER INCOME AGES 45 - 64 YEARS
0.0/ 100
METRIC RATING
317th/ 347
METRIC RANK
$114,754
HOUSEHOLDER INCOME AGES 45 - 64 YEARS
99.9/ 100
METRIC RATING
37th/ 347
METRIC RANK
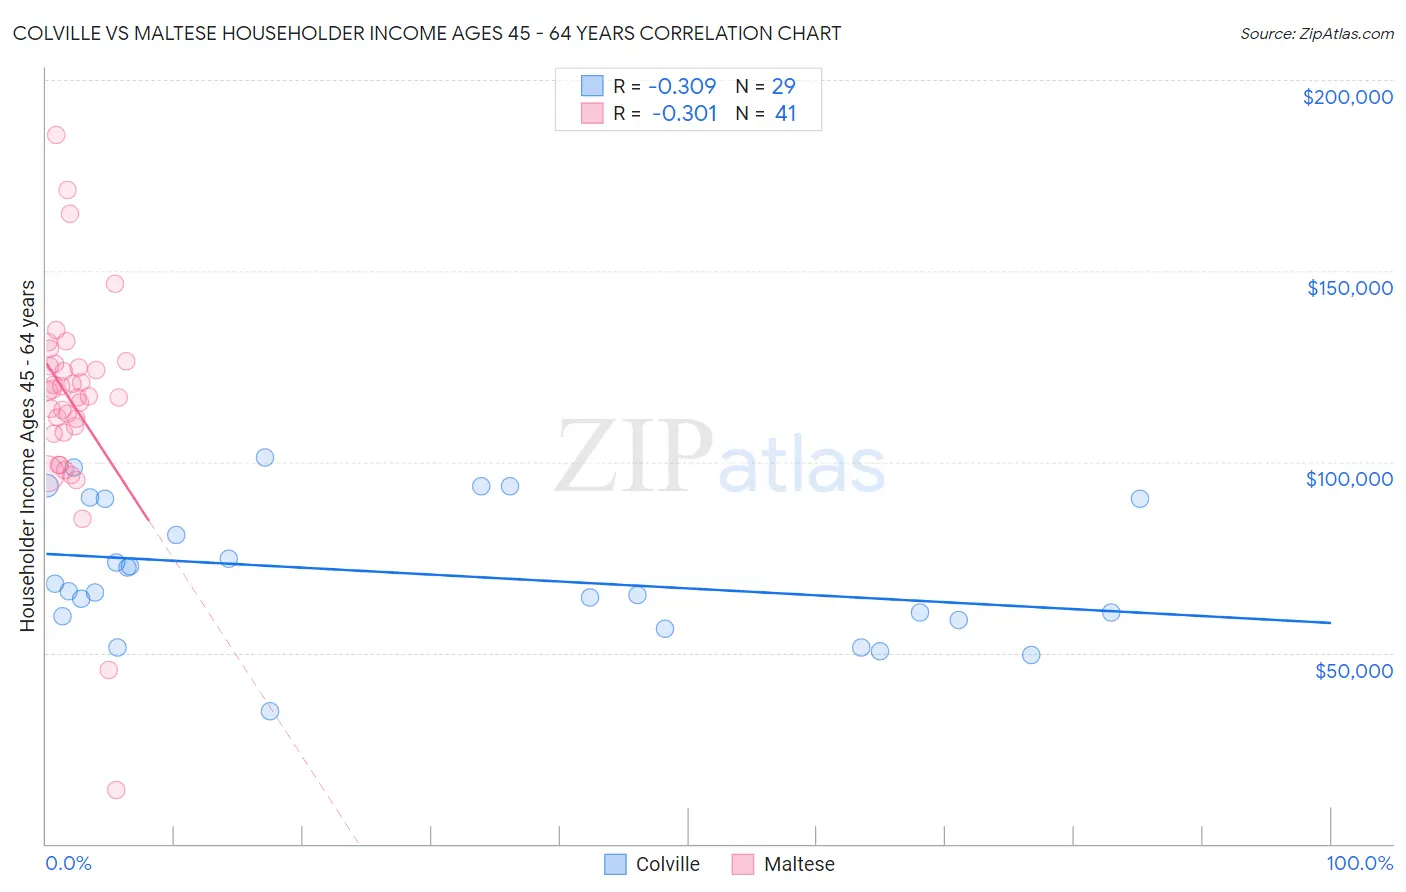
Colville vs Maltese Householder Income Ages 45 - 64 years Correlation Chart
The statistical analysis conducted on geographies consisting of 34,670,712 people shows a mild negative correlation between the proportion of Colville and household income with householder between the ages 45 and 64 in the United States with a correlation coefficient (R) of -0.309 and weighted average of $82,474. Similarly, the statistical analysis conducted on geographies consisting of 126,382,514 people shows a mild negative correlation between the proportion of Maltese and household income with householder between the ages 45 and 64 in the United States with a correlation coefficient (R) of -0.301 and weighted average of $114,754, a difference of 39.1%.
Householder Income Ages 45 - 64 years Correlation Summary
| Measurement | Colville | Maltese |
| Minimum | $34,612 | $13,981 |
| Maximum | $101,250 | $185,467 |
| Range | $66,638 | $171,486 |
| Mean | $70,774 | $115,766 |
| Median | $66,115 | $117,344 |
| Interquartile 25% (IQ1) | $59,200 | $107,547 |
| Interquartile 75% (IQ3) | $90,249 | $125,345 |
| Interquartile Range (IQR) | $31,049 | $17,798 |
| Standard Deviation (Sample) | $17,280 | $28,044 |
| Standard Deviation (Population) | $16,979 | $27,700 |
Similar Demographics by Householder Income Ages 45 - 64 years
Demographics Similar to Colville by Householder Income Ages 45 - 64 years
In terms of householder income ages 45 - 64 years, the demographic groups most similar to Colville are Immigrants from Caribbean ($82,513, a difference of 0.050%), Paiute ($82,629, a difference of 0.19%), Choctaw ($82,287, a difference of 0.23%), Immigrants from Honduras ($82,697, a difference of 0.27%), and U.S. Virgin Islander ($82,736, a difference of 0.32%).
| Demographics | Rating | Rank | Householder Income Ages 45 - 64 years |
| Immigrants | Haiti | 0.0 /100 | #310 | Tragic $83,257 |
| Immigrants | Bahamas | 0.0 /100 | #311 | Tragic $83,177 |
| Cajuns | 0.0 /100 | #312 | Tragic $83,015 |
| U.S. Virgin Islanders | 0.0 /100 | #313 | Tragic $82,736 |
| Immigrants | Honduras | 0.0 /100 | #314 | Tragic $82,697 |
| Paiute | 0.0 /100 | #315 | Tragic $82,629 |
| Immigrants | Caribbean | 0.0 /100 | #316 | Tragic $82,513 |
| Colville | 0.0 /100 | #317 | Tragic $82,474 |
| Choctaw | 0.0 /100 | #318 | Tragic $82,287 |
| Chickasaw | 0.0 /100 | #319 | Tragic $82,193 |
| Apache | 0.0 /100 | #320 | Tragic $82,184 |
| Yuman | 0.0 /100 | #321 | Tragic $82,139 |
| Sioux | 0.0 /100 | #322 | Tragic $81,750 |
| Bahamians | 0.0 /100 | #323 | Tragic $81,369 |
| Yup'ik | 0.0 /100 | #324 | Tragic $81,000 |
Demographics Similar to Maltese by Householder Income Ages 45 - 64 years
In terms of householder income ages 45 - 64 years, the demographic groups most similar to Maltese are Immigrants from Pakistan ($114,434, a difference of 0.28%), Immigrants from Turkey ($114,407, a difference of 0.30%), Cambodian ($114,342, a difference of 0.36%), Immigrants from Lithuania ($114,336, a difference of 0.37%), and Estonian ($114,220, a difference of 0.47%).
| Demographics | Rating | Rank | Householder Income Ages 45 - 64 years |
| Immigrants | Bolivia | 100.0 /100 | #30 | Exceptional $117,731 |
| Immigrants | Asia | 100.0 /100 | #31 | Exceptional $116,566 |
| Russians | 100.0 /100 | #32 | Exceptional $116,328 |
| Chinese | 100.0 /100 | #33 | Exceptional $116,156 |
| Immigrants | Denmark | 100.0 /100 | #34 | Exceptional $116,000 |
| Latvians | 100.0 /100 | #35 | Exceptional $115,957 |
| Immigrants | Switzerland | 100.0 /100 | #36 | Exceptional $115,934 |
| Maltese | 99.9 /100 | #37 | Exceptional $114,754 |
| Immigrants | Pakistan | 99.9 /100 | #38 | Exceptional $114,434 |
| Immigrants | Turkey | 99.9 /100 | #39 | Exceptional $114,407 |
| Cambodians | 99.9 /100 | #40 | Exceptional $114,342 |
| Immigrants | Lithuania | 99.9 /100 | #41 | Exceptional $114,336 |
| Estonians | 99.9 /100 | #42 | Exceptional $114,220 |
| Israelis | 99.9 /100 | #43 | Exceptional $114,186 |
| Bulgarians | 99.9 /100 | #44 | Exceptional $113,883 |