Polish vs Maltese Householder Income Ages 45 - 64 years
COMPARE
Polish
Maltese
Householder Income Ages 45 - 64 years
Householder Income Ages 45 - 64 years Comparison
Poles
Maltese
$105,952
HOUSEHOLDER INCOME AGES 45 - 64 YEARS
94.4/ 100
METRIC RATING
121st/ 347
METRIC RANK
$114,754
HOUSEHOLDER INCOME AGES 45 - 64 YEARS
99.9/ 100
METRIC RATING
37th/ 347
METRIC RANK
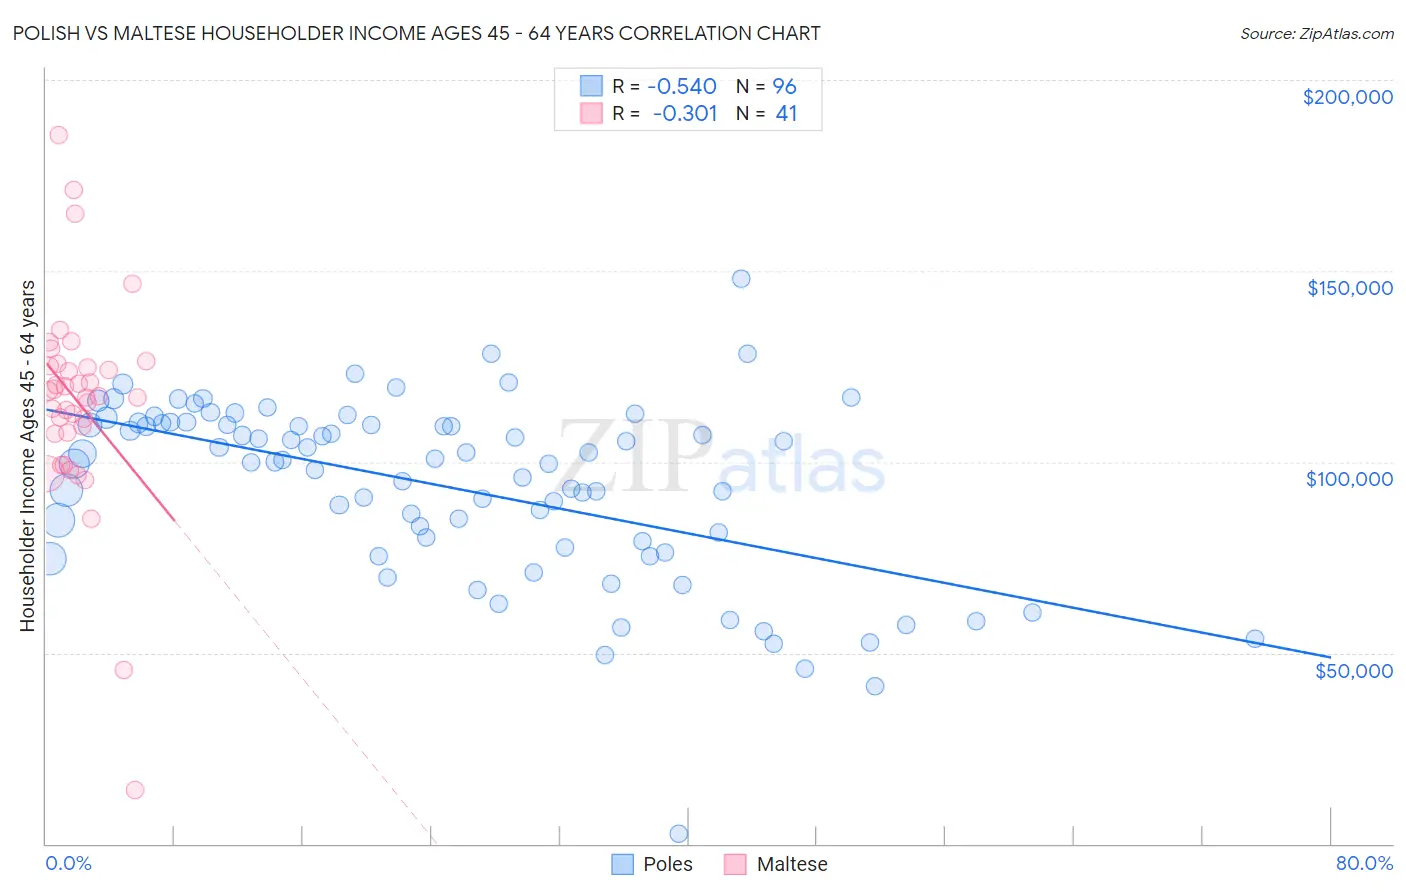
Polish vs Maltese Householder Income Ages 45 - 64 years Correlation Chart
The statistical analysis conducted on geographies consisting of 557,394,661 people shows a substantial negative correlation between the proportion of Poles and household income with householder between the ages 45 and 64 in the United States with a correlation coefficient (R) of -0.540 and weighted average of $105,952. Similarly, the statistical analysis conducted on geographies consisting of 126,382,514 people shows a mild negative correlation between the proportion of Maltese and household income with householder between the ages 45 and 64 in the United States with a correlation coefficient (R) of -0.301 and weighted average of $114,754, a difference of 8.3%.
Householder Income Ages 45 - 64 years Correlation Summary
| Measurement | Polish | Maltese |
| Minimum | $2,499 | $13,981 |
| Maximum | $147,814 | $185,467 |
| Range | $145,315 | $171,486 |
| Mean | $93,436 | $115,766 |
| Median | $100,304 | $117,344 |
| Interquartile 25% (IQ1) | $78,490 | $107,547 |
| Interquartile 75% (IQ3) | $109,945 | $125,345 |
| Interquartile Range (IQR) | $31,456 | $17,798 |
| Standard Deviation (Sample) | $23,791 | $28,044 |
| Standard Deviation (Population) | $23,667 | $27,700 |
Similar Demographics by Householder Income Ages 45 - 64 years
Demographics Similar to Poles by Householder Income Ages 45 - 64 years
In terms of householder income ages 45 - 64 years, the demographic groups most similar to Poles are Immigrants from North Macedonia ($105,892, a difference of 0.060%), Immigrants from South Eastern Asia ($106,109, a difference of 0.15%), Immigrants from Jordan ($106,164, a difference of 0.20%), Immigrants from Western Asia ($106,217, a difference of 0.25%), and Albanian ($106,243, a difference of 0.27%).
| Demographics | Rating | Rank | Householder Income Ages 45 - 64 years |
| Immigrants | Poland | 95.3 /100 | #114 | Exceptional $106,319 |
| Immigrants | Kuwait | 95.2 /100 | #115 | Exceptional $106,285 |
| British | 95.2 /100 | #116 | Exceptional $106,264 |
| Albanians | 95.1 /100 | #117 | Exceptional $106,243 |
| Immigrants | Western Asia | 95.0 /100 | #118 | Exceptional $106,217 |
| Immigrants | Jordan | 94.9 /100 | #119 | Exceptional $106,164 |
| Immigrants | South Eastern Asia | 94.8 /100 | #120 | Exceptional $106,109 |
| Poles | 94.4 /100 | #121 | Exceptional $105,952 |
| Immigrants | North Macedonia | 94.2 /100 | #122 | Exceptional $105,892 |
| Danes | 93.4 /100 | #123 | Exceptional $105,619 |
| Immigrants | Northern Africa | 92.8 /100 | #124 | Exceptional $105,430 |
| Pakistanis | 92.4 /100 | #125 | Exceptional $105,317 |
| Portuguese | 92.4 /100 | #126 | Exceptional $105,309 |
| Immigrants | Saudi Arabia | 92.2 /100 | #127 | Exceptional $105,249 |
| Native Hawaiians | 91.8 /100 | #128 | Exceptional $105,149 |
Demographics Similar to Maltese by Householder Income Ages 45 - 64 years
In terms of householder income ages 45 - 64 years, the demographic groups most similar to Maltese are Immigrants from Pakistan ($114,434, a difference of 0.28%), Immigrants from Turkey ($114,407, a difference of 0.30%), Cambodian ($114,342, a difference of 0.36%), Immigrants from Lithuania ($114,336, a difference of 0.37%), and Estonian ($114,220, a difference of 0.47%).
| Demographics | Rating | Rank | Householder Income Ages 45 - 64 years |
| Immigrants | Bolivia | 100.0 /100 | #30 | Exceptional $117,731 |
| Immigrants | Asia | 100.0 /100 | #31 | Exceptional $116,566 |
| Russians | 100.0 /100 | #32 | Exceptional $116,328 |
| Chinese | 100.0 /100 | #33 | Exceptional $116,156 |
| Immigrants | Denmark | 100.0 /100 | #34 | Exceptional $116,000 |
| Latvians | 100.0 /100 | #35 | Exceptional $115,957 |
| Immigrants | Switzerland | 100.0 /100 | #36 | Exceptional $115,934 |
| Maltese | 99.9 /100 | #37 | Exceptional $114,754 |
| Immigrants | Pakistan | 99.9 /100 | #38 | Exceptional $114,434 |
| Immigrants | Turkey | 99.9 /100 | #39 | Exceptional $114,407 |
| Cambodians | 99.9 /100 | #40 | Exceptional $114,342 |
| Immigrants | Lithuania | 99.9 /100 | #41 | Exceptional $114,336 |
| Estonians | 99.9 /100 | #42 | Exceptional $114,220 |
| Israelis | 99.9 /100 | #43 | Exceptional $114,186 |
| Bulgarians | 99.9 /100 | #44 | Exceptional $113,883 |