Colville vs Armenian Householder Income Ages 45 - 64 years
COMPARE
Colville
Armenian
Householder Income Ages 45 - 64 years
Householder Income Ages 45 - 64 years Comparison
Colville
Armenians
$82,474
HOUSEHOLDER INCOME AGES 45 - 64 YEARS
0.0/ 100
METRIC RATING
317th/ 347
METRIC RANK
$107,002
HOUSEHOLDER INCOME AGES 45 - 64 YEARS
96.6/ 100
METRIC RATING
106th/ 347
METRIC RANK
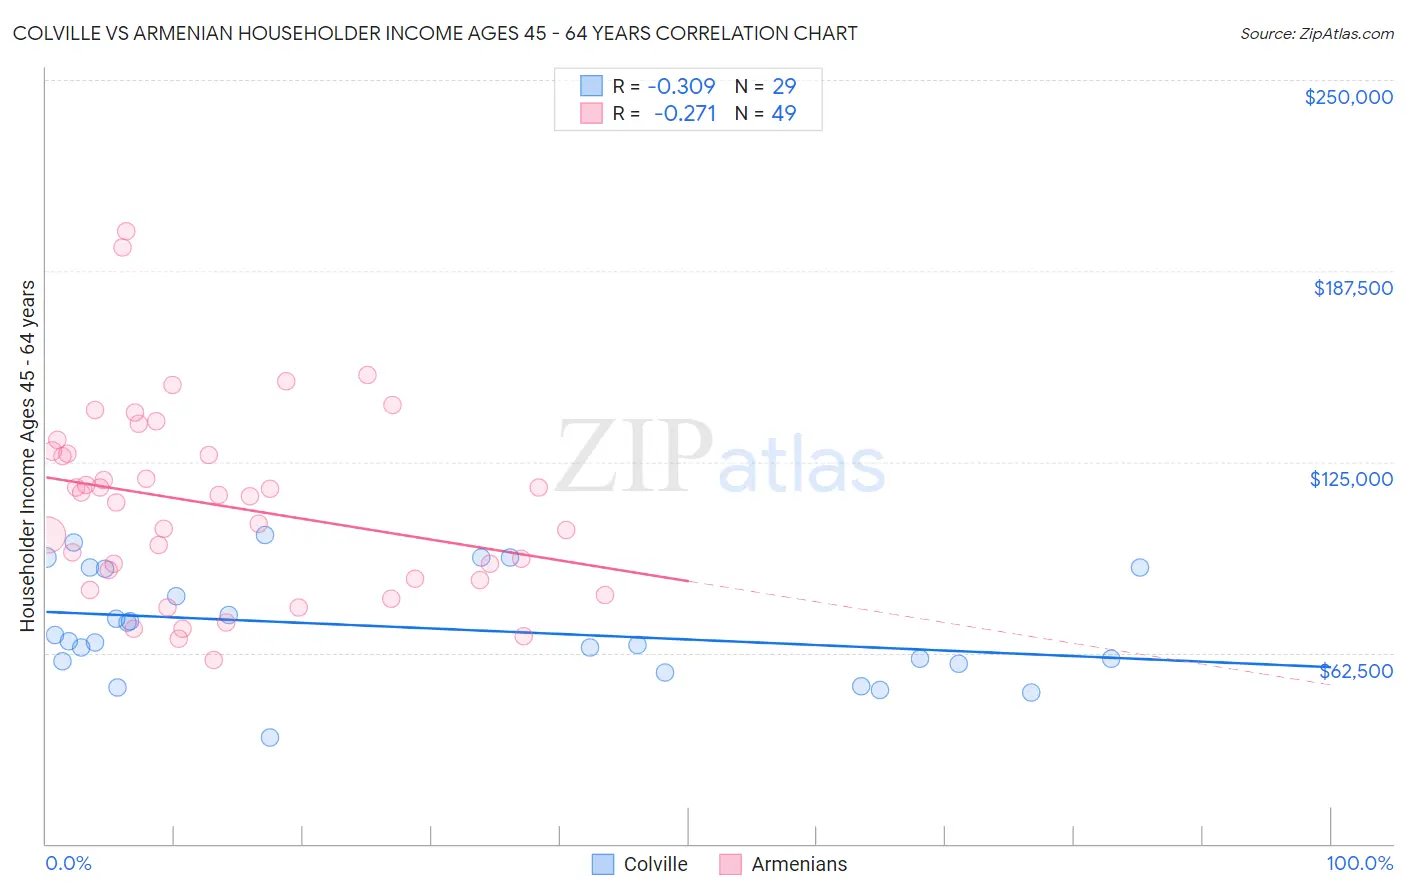
Colville vs Armenian Householder Income Ages 45 - 64 years Correlation Chart
The statistical analysis conducted on geographies consisting of 34,670,712 people shows a mild negative correlation between the proportion of Colville and household income with householder between the ages 45 and 64 in the United States with a correlation coefficient (R) of -0.309 and weighted average of $82,474. Similarly, the statistical analysis conducted on geographies consisting of 310,526,639 people shows a weak negative correlation between the proportion of Armenians and household income with householder between the ages 45 and 64 in the United States with a correlation coefficient (R) of -0.271 and weighted average of $107,002, a difference of 29.7%.
Householder Income Ages 45 - 64 years Correlation Summary
| Measurement | Colville | Armenian |
| Minimum | $34,612 | $60,000 |
| Maximum | $101,250 | $200,625 |
| Range | $66,638 | $140,625 |
| Mean | $70,774 | $110,676 |
| Median | $66,115 | $113,807 |
| Interquartile 25% (IQ1) | $59,200 | $86,427 |
| Interquartile 75% (IQ3) | $90,249 | $128,076 |
| Interquartile Range (IQR) | $31,049 | $41,649 |
| Standard Deviation (Sample) | $17,280 | $30,867 |
| Standard Deviation (Population) | $16,979 | $30,551 |
Similar Demographics by Householder Income Ages 45 - 64 years
Demographics Similar to Colville by Householder Income Ages 45 - 64 years
In terms of householder income ages 45 - 64 years, the demographic groups most similar to Colville are Immigrants from Caribbean ($82,513, a difference of 0.050%), Paiute ($82,629, a difference of 0.19%), Choctaw ($82,287, a difference of 0.23%), Immigrants from Honduras ($82,697, a difference of 0.27%), and U.S. Virgin Islander ($82,736, a difference of 0.32%).
| Demographics | Rating | Rank | Householder Income Ages 45 - 64 years |
| Immigrants | Haiti | 0.0 /100 | #310 | Tragic $83,257 |
| Immigrants | Bahamas | 0.0 /100 | #311 | Tragic $83,177 |
| Cajuns | 0.0 /100 | #312 | Tragic $83,015 |
| U.S. Virgin Islanders | 0.0 /100 | #313 | Tragic $82,736 |
| Immigrants | Honduras | 0.0 /100 | #314 | Tragic $82,697 |
| Paiute | 0.0 /100 | #315 | Tragic $82,629 |
| Immigrants | Caribbean | 0.0 /100 | #316 | Tragic $82,513 |
| Colville | 0.0 /100 | #317 | Tragic $82,474 |
| Choctaw | 0.0 /100 | #318 | Tragic $82,287 |
| Chickasaw | 0.0 /100 | #319 | Tragic $82,193 |
| Apache | 0.0 /100 | #320 | Tragic $82,184 |
| Yuman | 0.0 /100 | #321 | Tragic $82,139 |
| Sioux | 0.0 /100 | #322 | Tragic $81,750 |
| Bahamians | 0.0 /100 | #323 | Tragic $81,369 |
| Yup'ik | 0.0 /100 | #324 | Tragic $81,000 |
Demographics Similar to Armenians by Householder Income Ages 45 - 64 years
In terms of householder income ages 45 - 64 years, the demographic groups most similar to Armenians are Immigrants from Fiji ($106,952, a difference of 0.050%), Immigrants from Ukraine ($107,079, a difference of 0.070%), Macedonian ($107,074, a difference of 0.070%), Zimbabwean ($106,849, a difference of 0.14%), and Syrian ($107,207, a difference of 0.19%).
| Demographics | Rating | Rank | Householder Income Ages 45 - 64 years |
| Palestinians | 97.6 /100 | #99 | Exceptional $107,721 |
| Immigrants | Serbia | 97.4 /100 | #100 | Exceptional $107,569 |
| Immigrants | Kazakhstan | 97.2 /100 | #101 | Exceptional $107,378 |
| Immigrants | Moldova | 97.1 /100 | #102 | Exceptional $107,357 |
| Syrians | 96.9 /100 | #103 | Exceptional $107,207 |
| Immigrants | Ukraine | 96.7 /100 | #104 | Exceptional $107,079 |
| Macedonians | 96.7 /100 | #105 | Exceptional $107,074 |
| Armenians | 96.6 /100 | #106 | Exceptional $107,002 |
| Immigrants | Fiji | 96.5 /100 | #107 | Exceptional $106,952 |
| Zimbabweans | 96.3 /100 | #108 | Exceptional $106,849 |
| Chileans | 95.9 /100 | #109 | Exceptional $106,611 |
| Immigrants | Brazil | 95.6 /100 | #110 | Exceptional $106,470 |
| Immigrants | Vietnam | 95.5 /100 | #111 | Exceptional $106,417 |
| Swedes | 95.4 /100 | #112 | Exceptional $106,377 |
| Europeans | 95.4 /100 | #113 | Exceptional $106,367 |