Colville vs Maltese In Labor Force | Age 20-24
COMPARE
Colville
Maltese
In Labor Force | Age 20-24
In Labor Force | Age 20-24 Comparison
Colville
Maltese
73.9%
IN LABOR FORCE | AGE 20-24
1.5/ 100
METRIC RATING
247th/ 347
METRIC RANK
76.3%
IN LABOR FORCE | AGE 20-24
98.9/ 100
METRIC RATING
92nd/ 347
METRIC RANK
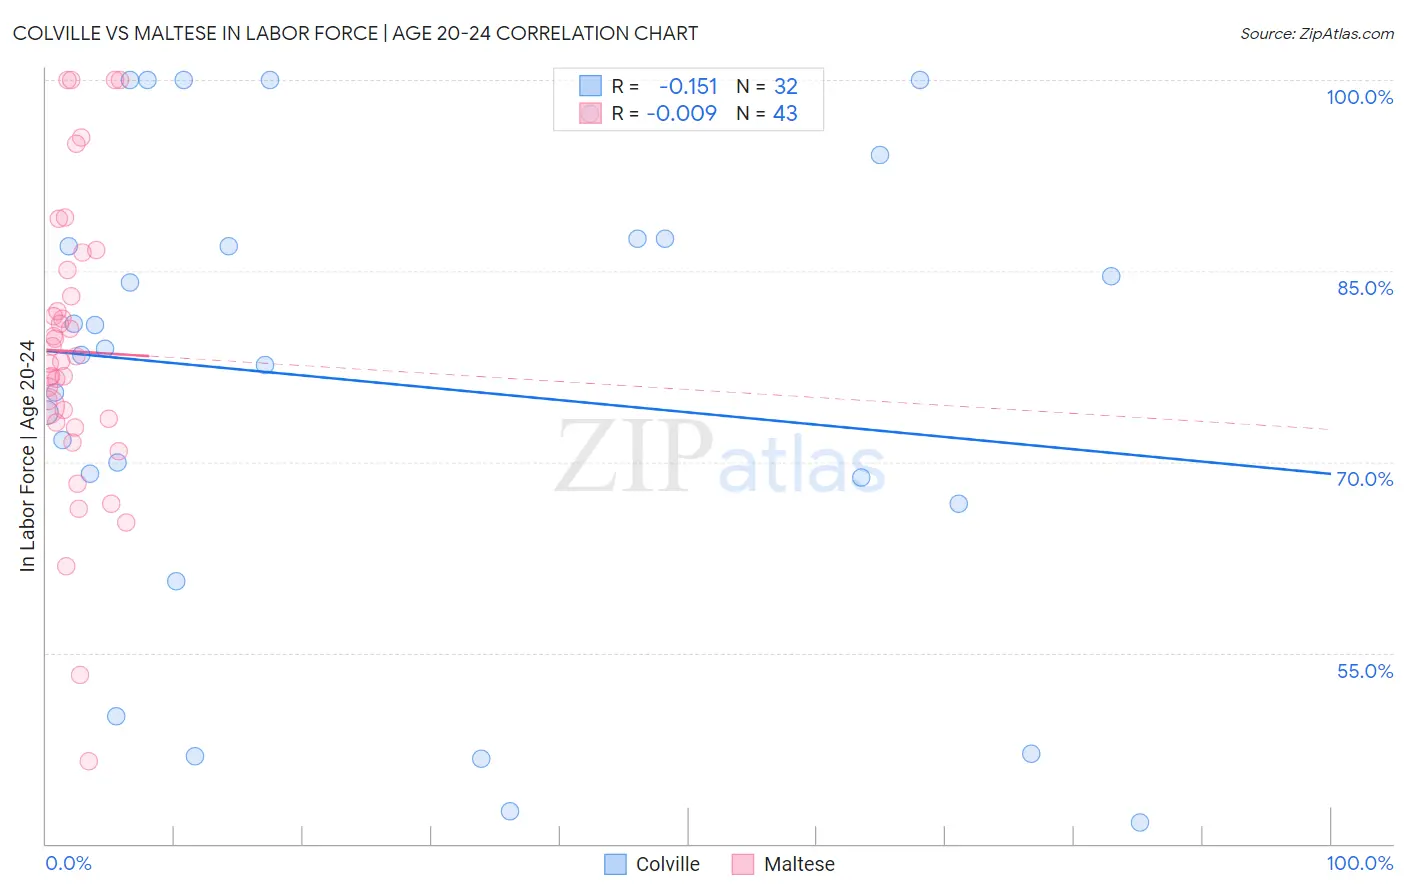
Colville vs Maltese In Labor Force | Age 20-24 Correlation Chart
The statistical analysis conducted on geographies consisting of 34,682,929 people shows a poor negative correlation between the proportion of Colville and labor force participation rate among population between the ages 20 and 24 in the United States with a correlation coefficient (R) of -0.151 and weighted average of 73.9%. Similarly, the statistical analysis conducted on geographies consisting of 126,433,922 people shows no correlation between the proportion of Maltese and labor force participation rate among population between the ages 20 and 24 in the United States with a correlation coefficient (R) of -0.009 and weighted average of 76.3%, a difference of 3.3%.
In Labor Force | Age 20-24 Correlation Summary
| Measurement | Colville | Maltese |
| Minimum | 41.7% | 46.5% |
| Maximum | 100.0% | 100.0% |
| Range | 58.3% | 53.5% |
| Mean | 76.1% | 78.7% |
| Median | 78.6% | 77.9% |
| Interquartile 25% (IQ1) | 67.7% | 73.1% |
| Interquartile 75% (IQ3) | 87.5% | 85.1% |
| Interquartile Range (IQR) | 19.8% | 12.0% |
| Standard Deviation (Sample) | 18.3% | 11.6% |
| Standard Deviation (Population) | 18.0% | 11.5% |
Similar Demographics by In Labor Force | Age 20-24
Demographics Similar to Colville by In Labor Force | Age 20-24
In terms of in labor force | age 20-24, the demographic groups most similar to Colville are Immigrants from Saudi Arabia (73.9%, a difference of 0.0%), Immigrants from Panama (73.9%, a difference of 0.030%), Black/African American (73.9%, a difference of 0.050%), Immigrants from Belgium (73.9%, a difference of 0.060%), and Turkish (73.9%, a difference of 0.070%).
| Demographics | Rating | Rank | In Labor Force | Age 20-24 |
| Immigrants | Sri Lanka | 2.3 /100 | #240 | Tragic 74.0% |
| Immigrants | Senegal | 2.1 /100 | #241 | Tragic 74.0% |
| Thais | 2.1 /100 | #242 | Tragic 74.0% |
| Immigrants | Syria | 1.9 /100 | #243 | Tragic 74.0% |
| Immigrants | South Central Asia | 1.9 /100 | #244 | Tragic 74.0% |
| Turks | 1.8 /100 | #245 | Tragic 73.9% |
| Immigrants | Panama | 1.6 /100 | #246 | Tragic 73.9% |
| Colville | 1.5 /100 | #247 | Tragic 73.9% |
| Immigrants | Saudi Arabia | 1.5 /100 | #248 | Tragic 73.9% |
| Blacks/African Americans | 1.3 /100 | #249 | Tragic 73.9% |
| Immigrants | Belgium | 1.3 /100 | #250 | Tragic 73.9% |
| Immigrants | Egypt | 1.2 /100 | #251 | Tragic 73.8% |
| Immigrants | Kazakhstan | 1.1 /100 | #252 | Tragic 73.8% |
| Arapaho | 1.0 /100 | #253 | Tragic 73.8% |
| Ute | 1.0 /100 | #254 | Tragic 73.8% |
Demographics Similar to Maltese by In Labor Force | Age 20-24
In terms of in labor force | age 20-24, the demographic groups most similar to Maltese are Hungarian (76.3%, a difference of 0.020%), Sierra Leonean (76.3%, a difference of 0.030%), Immigrants from Burma/Myanmar (76.3%, a difference of 0.050%), Spanish (76.4%, a difference of 0.10%), and Bulgarian (76.4%, a difference of 0.10%).
| Demographics | Rating | Rank | In Labor Force | Age 20-24 |
| Portuguese | 99.3 /100 | #85 | Exceptional 76.4% |
| Immigrants | Iraq | 99.3 /100 | #86 | Exceptional 76.4% |
| Immigrants | Thailand | 99.3 /100 | #87 | Exceptional 76.4% |
| Spanish | 99.2 /100 | #88 | Exceptional 76.4% |
| Bulgarians | 99.2 /100 | #89 | Exceptional 76.4% |
| Immigrants | Burma/Myanmar | 99.1 /100 | #90 | Exceptional 76.3% |
| Sierra Leoneans | 99.0 /100 | #91 | Exceptional 76.3% |
| Maltese | 98.9 /100 | #92 | Exceptional 76.3% |
| Hungarians | 98.9 /100 | #93 | Exceptional 76.3% |
| Potawatomi | 98.5 /100 | #94 | Exceptional 76.2% |
| Immigrants | Germany | 98.5 /100 | #95 | Exceptional 76.2% |
| Immigrants | Nonimmigrants | 98.5 /100 | #96 | Exceptional 76.2% |
| Immigrants | Lithuania | 98.0 /100 | #97 | Exceptional 76.1% |
| Immigrants | Oceania | 98.0 /100 | #98 | Exceptional 76.1% |
| Americans | 97.8 /100 | #99 | Exceptional 76.1% |