Colville vs Cheyenne Householder Income Ages 45 - 64 years
COMPARE
Colville
Cheyenne
Householder Income Ages 45 - 64 years
Householder Income Ages 45 - 64 years Comparison
Colville
Cheyenne
$82,474
HOUSEHOLDER INCOME AGES 45 - 64 YEARS
0.0/ 100
METRIC RATING
317th/ 347
METRIC RANK
$76,362
HOUSEHOLDER INCOME AGES 45 - 64 YEARS
0.0/ 100
METRIC RATING
335th/ 347
METRIC RANK
Colville vs Cheyenne Householder Income Ages 45 - 64 years Correlation Chart
The statistical analysis conducted on geographies consisting of 34,670,712 people shows a mild negative correlation between the proportion of Colville and household income with householder between the ages 45 and 64 in the United States with a correlation coefficient (R) of -0.309 and weighted average of $82,474. Similarly, the statistical analysis conducted on geographies consisting of 80,666,716 people shows a mild negative correlation between the proportion of Cheyenne and household income with householder between the ages 45 and 64 in the United States with a correlation coefficient (R) of -0.394 and weighted average of $76,362, a difference of 8.0%.
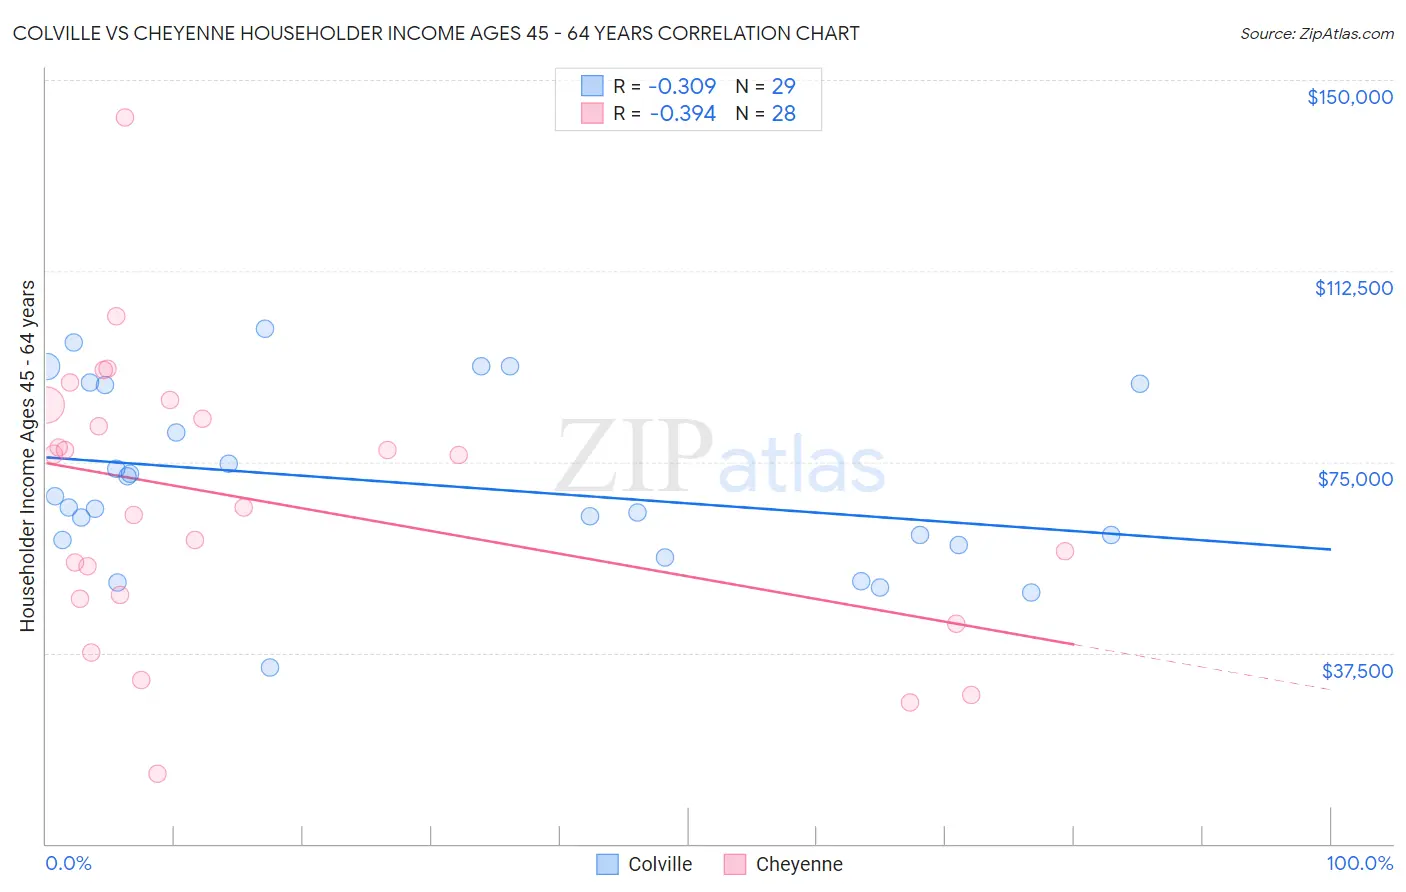
Householder Income Ages 45 - 64 years Correlation Summary
| Measurement | Colville | Cheyenne |
| Minimum | $34,612 | $13,750 |
| Maximum | $101,250 | $142,727 |
| Range | $66,638 | $128,977 |
| Mean | $70,774 | $67,332 |
| Median | $66,115 | $71,250 |
| Interquartile 25% (IQ1) | $59,200 | $48,460 |
| Interquartile 75% (IQ3) | $90,249 | $84,816 |
| Interquartile Range (IQR) | $31,049 | $36,356 |
| Standard Deviation (Sample) | $17,280 | $27,465 |
| Standard Deviation (Population) | $16,979 | $26,970 |
Demographics Similar to Colville and Cheyenne by Householder Income Ages 45 - 64 years
In terms of householder income ages 45 - 64 years, the demographic groups most similar to Colville are Immigrants from Caribbean ($82,513, a difference of 0.050%), Choctaw ($82,287, a difference of 0.23%), Chickasaw ($82,193, a difference of 0.34%), Apache ($82,184, a difference of 0.35%), and Yuman ($82,139, a difference of 0.41%). Similarly, the demographic groups most similar to Cheyenne are Arapaho ($75,945, a difference of 0.55%), Menominee ($76,903, a difference of 0.71%), Immigrants from Congo ($77,850, a difference of 1.9%), Black/African American ($78,556, a difference of 2.9%), and Immigrants from Dominican Republic ($78,836, a difference of 3.2%).
| Demographics | Rating | Rank | Householder Income Ages 45 - 64 years |
| Immigrants | Caribbean | 0.0 /100 | #316 | Tragic $82,513 |
| Colville | 0.0 /100 | #317 | Tragic $82,474 |
| Choctaw | 0.0 /100 | #318 | Tragic $82,287 |
| Chickasaw | 0.0 /100 | #319 | Tragic $82,193 |
| Apache | 0.0 /100 | #320 | Tragic $82,184 |
| Yuman | 0.0 /100 | #321 | Tragic $82,139 |
| Sioux | 0.0 /100 | #322 | Tragic $81,750 |
| Bahamians | 0.0 /100 | #323 | Tragic $81,369 |
| Yup'ik | 0.0 /100 | #324 | Tragic $81,000 |
| Immigrants | Cuba | 0.0 /100 | #325 | Tragic $80,662 |
| Dominicans | 0.0 /100 | #326 | Tragic $80,623 |
| Seminole | 0.0 /100 | #327 | Tragic $80,077 |
| Natives/Alaskans | 0.0 /100 | #328 | Tragic $79,816 |
| Dutch West Indians | 0.0 /100 | #329 | Tragic $79,171 |
| Creek | 0.0 /100 | #330 | Tragic $78,960 |
| Immigrants | Dominican Republic | 0.0 /100 | #331 | Tragic $78,836 |
| Blacks/African Americans | 0.0 /100 | #332 | Tragic $78,556 |
| Immigrants | Congo | 0.0 /100 | #333 | Tragic $77,850 |
| Menominee | 0.0 /100 | #334 | Tragic $76,903 |
| Cheyenne | 0.0 /100 | #335 | Tragic $76,362 |
| Arapaho | 0.0 /100 | #336 | Tragic $75,945 |