Colville vs Bahamian Householder Income Ages 45 - 64 years
COMPARE
Colville
Bahamian
Householder Income Ages 45 - 64 years
Householder Income Ages 45 - 64 years Comparison
Colville
Bahamians
$82,474
HOUSEHOLDER INCOME AGES 45 - 64 YEARS
0.0/ 100
METRIC RATING
317th/ 347
METRIC RANK
$81,369
HOUSEHOLDER INCOME AGES 45 - 64 YEARS
0.0/ 100
METRIC RATING
323rd/ 347
METRIC RANK
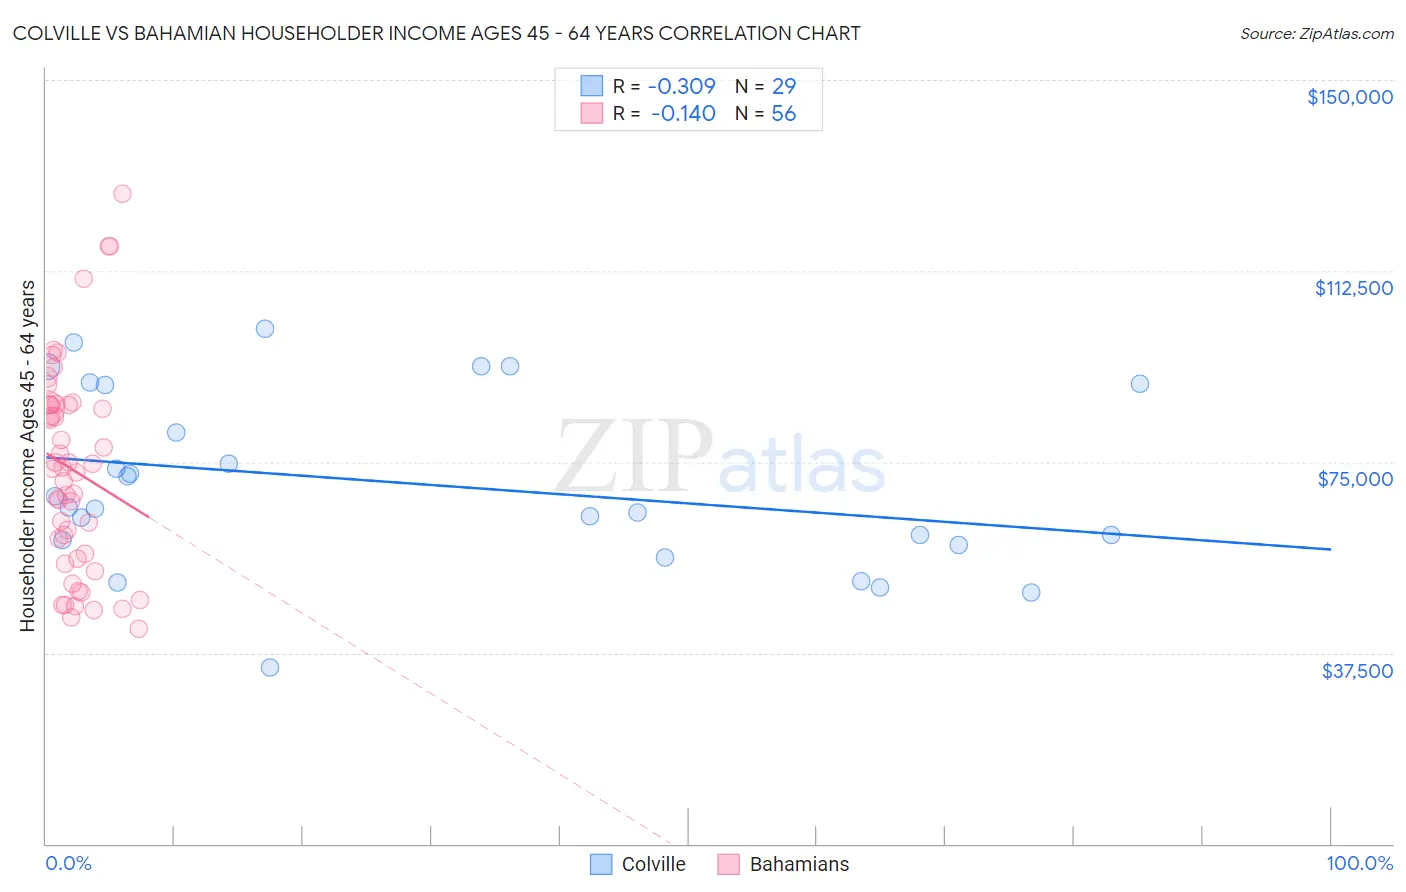
Colville vs Bahamian Householder Income Ages 45 - 64 years Correlation Chart
The statistical analysis conducted on geographies consisting of 34,670,712 people shows a mild negative correlation between the proportion of Colville and household income with householder between the ages 45 and 64 in the United States with a correlation coefficient (R) of -0.309 and weighted average of $82,474. Similarly, the statistical analysis conducted on geographies consisting of 112,556,125 people shows a poor negative correlation between the proportion of Bahamians and household income with householder between the ages 45 and 64 in the United States with a correlation coefficient (R) of -0.140 and weighted average of $81,369, a difference of 1.4%.
Householder Income Ages 45 - 64 years Correlation Summary
| Measurement | Colville | Bahamian |
| Minimum | $34,612 | $42,237 |
| Maximum | $101,250 | $127,688 |
| Range | $66,638 | $85,451 |
| Mean | $70,774 | $73,458 |
| Median | $66,115 | $73,730 |
| Interquartile 25% (IQ1) | $59,200 | $56,503 |
| Interquartile 75% (IQ3) | $90,249 | $86,250 |
| Interquartile Range (IQR) | $31,049 | $29,747 |
| Standard Deviation (Sample) | $17,280 | $20,194 |
| Standard Deviation (Population) | $16,979 | $20,012 |
Demographics Similar to Colville and Bahamians by Householder Income Ages 45 - 64 years
In terms of householder income ages 45 - 64 years, the demographic groups most similar to Colville are Immigrants from Caribbean ($82,513, a difference of 0.050%), Paiute ($82,629, a difference of 0.19%), Choctaw ($82,287, a difference of 0.23%), Immigrants from Honduras ($82,697, a difference of 0.27%), and U.S. Virgin Islander ($82,736, a difference of 0.32%). Similarly, the demographic groups most similar to Bahamians are Yup'ik ($81,000, a difference of 0.46%), Sioux ($81,750, a difference of 0.47%), Immigrants from Cuba ($80,662, a difference of 0.88%), Dominican ($80,623, a difference of 0.92%), and Yuman ($82,139, a difference of 0.95%).
| Demographics | Rating | Rank | Householder Income Ages 45 - 64 years |
| Immigrants | Haiti | 0.0 /100 | #310 | Tragic $83,257 |
| Immigrants | Bahamas | 0.0 /100 | #311 | Tragic $83,177 |
| Cajuns | 0.0 /100 | #312 | Tragic $83,015 |
| U.S. Virgin Islanders | 0.0 /100 | #313 | Tragic $82,736 |
| Immigrants | Honduras | 0.0 /100 | #314 | Tragic $82,697 |
| Paiute | 0.0 /100 | #315 | Tragic $82,629 |
| Immigrants | Caribbean | 0.0 /100 | #316 | Tragic $82,513 |
| Colville | 0.0 /100 | #317 | Tragic $82,474 |
| Choctaw | 0.0 /100 | #318 | Tragic $82,287 |
| Chickasaw | 0.0 /100 | #319 | Tragic $82,193 |
| Apache | 0.0 /100 | #320 | Tragic $82,184 |
| Yuman | 0.0 /100 | #321 | Tragic $82,139 |
| Sioux | 0.0 /100 | #322 | Tragic $81,750 |
| Bahamians | 0.0 /100 | #323 | Tragic $81,369 |
| Yup'ik | 0.0 /100 | #324 | Tragic $81,000 |
| Immigrants | Cuba | 0.0 /100 | #325 | Tragic $80,662 |
| Dominicans | 0.0 /100 | #326 | Tragic $80,623 |
| Seminole | 0.0 /100 | #327 | Tragic $80,077 |
| Natives/Alaskans | 0.0 /100 | #328 | Tragic $79,816 |
| Dutch West Indians | 0.0 /100 | #329 | Tragic $79,171 |
| Creek | 0.0 /100 | #330 | Tragic $78,960 |