Colville vs Scottish Householder Income Ages 45 - 64 years
COMPARE
Colville
Scottish
Householder Income Ages 45 - 64 years
Householder Income Ages 45 - 64 years Comparison
Colville
Scottish
$82,474
HOUSEHOLDER INCOME AGES 45 - 64 YEARS
0.0/ 100
METRIC RATING
317th/ 347
METRIC RANK
$102,123
HOUSEHOLDER INCOME AGES 45 - 64 YEARS
71.1/ 100
METRIC RATING
162nd/ 347
METRIC RANK
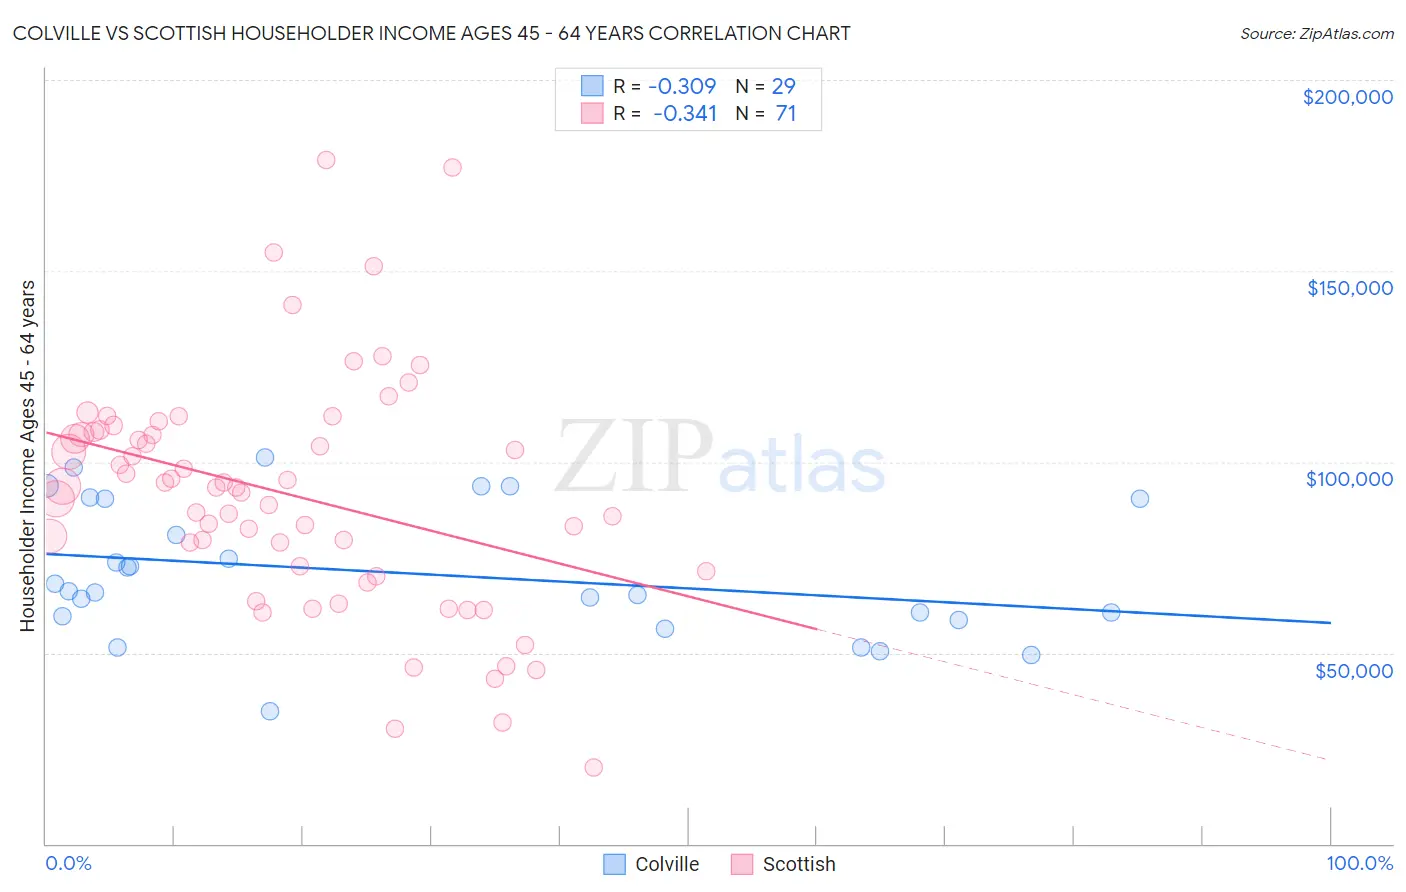
Colville vs Scottish Householder Income Ages 45 - 64 years Correlation Chart
The statistical analysis conducted on geographies consisting of 34,670,712 people shows a mild negative correlation between the proportion of Colville and household income with householder between the ages 45 and 64 in the United States with a correlation coefficient (R) of -0.309 and weighted average of $82,474. Similarly, the statistical analysis conducted on geographies consisting of 563,389,205 people shows a mild negative correlation between the proportion of Scottish and household income with householder between the ages 45 and 64 in the United States with a correlation coefficient (R) of -0.341 and weighted average of $102,123, a difference of 23.8%.
Householder Income Ages 45 - 64 years Correlation Summary
| Measurement | Colville | Scottish |
| Minimum | $34,612 | $20,057 |
| Maximum | $101,250 | $179,004 |
| Range | $66,638 | $158,947 |
| Mean | $70,774 | $91,449 |
| Median | $66,115 | $93,434 |
| Interquartile 25% (IQ1) | $59,200 | $71,369 |
| Interquartile 75% (IQ3) | $90,249 | $107,815 |
| Interquartile Range (IQR) | $31,049 | $36,446 |
| Standard Deviation (Sample) | $17,280 | $30,831 |
| Standard Deviation (Population) | $16,979 | $30,613 |
Similar Demographics by Householder Income Ages 45 - 64 years
Demographics Similar to Colville by Householder Income Ages 45 - 64 years
In terms of householder income ages 45 - 64 years, the demographic groups most similar to Colville are Immigrants from Caribbean ($82,513, a difference of 0.050%), Paiute ($82,629, a difference of 0.19%), Choctaw ($82,287, a difference of 0.23%), Immigrants from Honduras ($82,697, a difference of 0.27%), and U.S. Virgin Islander ($82,736, a difference of 0.32%).
| Demographics | Rating | Rank | Householder Income Ages 45 - 64 years |
| Immigrants | Haiti | 0.0 /100 | #310 | Tragic $83,257 |
| Immigrants | Bahamas | 0.0 /100 | #311 | Tragic $83,177 |
| Cajuns | 0.0 /100 | #312 | Tragic $83,015 |
| U.S. Virgin Islanders | 0.0 /100 | #313 | Tragic $82,736 |
| Immigrants | Honduras | 0.0 /100 | #314 | Tragic $82,697 |
| Paiute | 0.0 /100 | #315 | Tragic $82,629 |
| Immigrants | Caribbean | 0.0 /100 | #316 | Tragic $82,513 |
| Colville | 0.0 /100 | #317 | Tragic $82,474 |
| Choctaw | 0.0 /100 | #318 | Tragic $82,287 |
| Chickasaw | 0.0 /100 | #319 | Tragic $82,193 |
| Apache | 0.0 /100 | #320 | Tragic $82,184 |
| Yuman | 0.0 /100 | #321 | Tragic $82,139 |
| Sioux | 0.0 /100 | #322 | Tragic $81,750 |
| Bahamians | 0.0 /100 | #323 | Tragic $81,369 |
| Yup'ik | 0.0 /100 | #324 | Tragic $81,000 |
Demographics Similar to Scottish by Householder Income Ages 45 - 64 years
In terms of householder income ages 45 - 64 years, the demographic groups most similar to Scottish are Immigrants from Nepal ($102,190, a difference of 0.070%), English ($102,021, a difference of 0.10%), Immigrants from Morocco ($102,015, a difference of 0.11%), Icelander ($102,261, a difference of 0.14%), and Immigrants from Albania ($101,957, a difference of 0.16%).
| Demographics | Rating | Rank | Householder Income Ages 45 - 64 years |
| Costa Ricans | 77.4 /100 | #155 | Good $102,779 |
| Carpatho Rusyns | 77.4 /100 | #156 | Good $102,777 |
| Immigrants | Ethiopia | 77.3 /100 | #157 | Good $102,763 |
| Slavs | 76.1 /100 | #158 | Good $102,629 |
| Sierra Leoneans | 74.2 /100 | #159 | Good $102,427 |
| Icelanders | 72.5 /100 | #160 | Good $102,261 |
| Immigrants | Nepal | 71.8 /100 | #161 | Good $102,190 |
| Scottish | 71.1 /100 | #162 | Good $102,123 |
| English | 70.1 /100 | #163 | Good $102,021 |
| Immigrants | Morocco | 70.0 /100 | #164 | Good $102,015 |
| Immigrants | Albania | 69.4 /100 | #165 | Good $101,957 |
| Samoans | 65.3 /100 | #166 | Good $101,580 |
| Czechoslovakians | 63.0 /100 | #167 | Good $101,387 |
| South American Indians | 60.5 /100 | #168 | Good $101,171 |
| Guamanians/Chamorros | 60.5 /100 | #169 | Good $101,170 |