Burmese vs Maltese Householder Income Ages 45 - 64 years
COMPARE
Burmese
Maltese
Householder Income Ages 45 - 64 years
Householder Income Ages 45 - 64 years Comparison
Burmese
Maltese
$121,444
HOUSEHOLDER INCOME AGES 45 - 64 YEARS
100.0/ 100
METRIC RATING
17th/ 347
METRIC RANK
$114,754
HOUSEHOLDER INCOME AGES 45 - 64 YEARS
99.9/ 100
METRIC RATING
37th/ 347
METRIC RANK
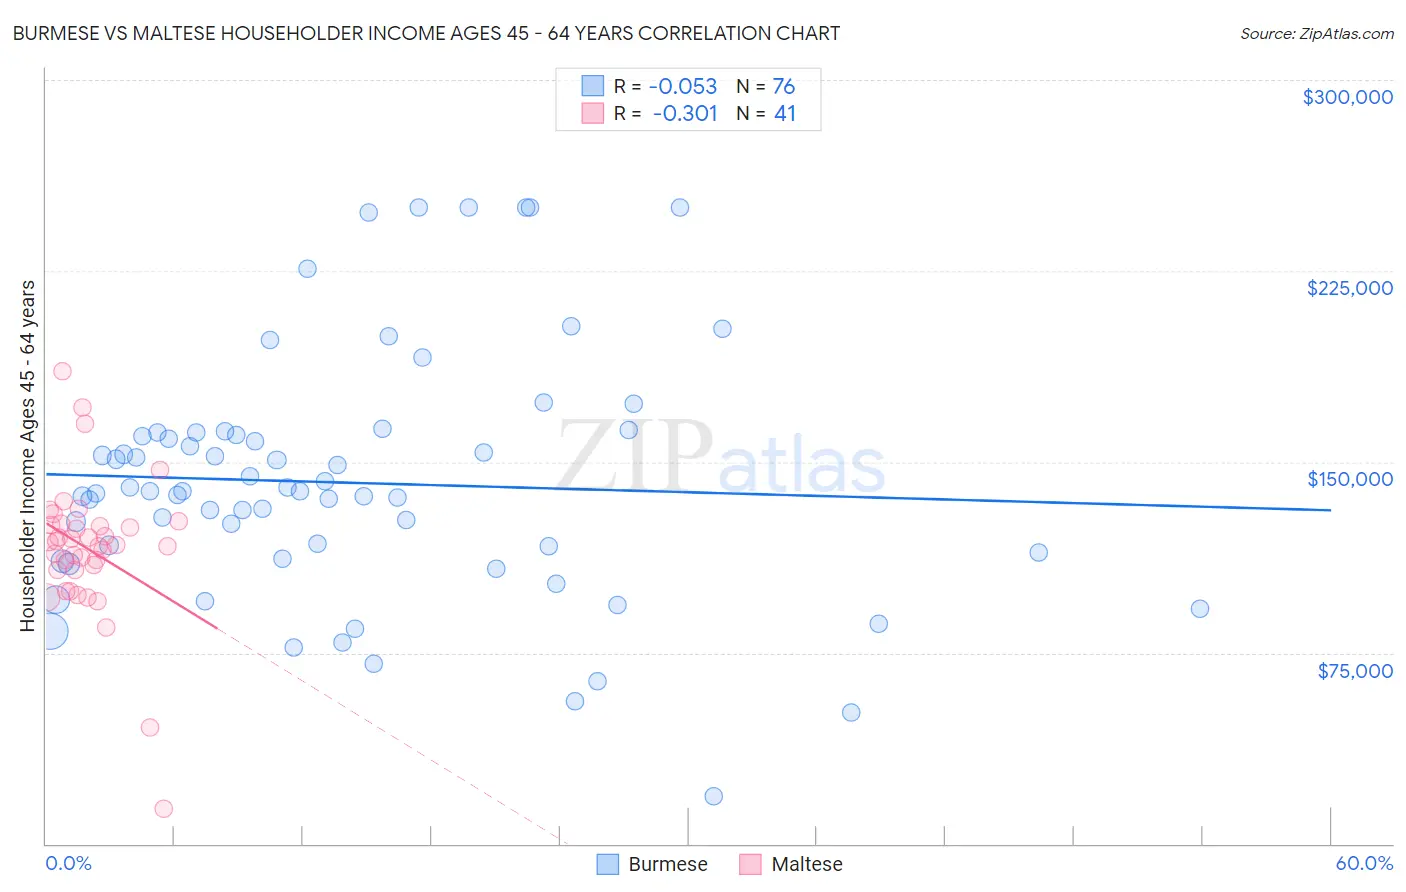
Burmese vs Maltese Householder Income Ages 45 - 64 years Correlation Chart
The statistical analysis conducted on geographies consisting of 464,084,220 people shows a slight negative correlation between the proportion of Burmese and household income with householder between the ages 45 and 64 in the United States with a correlation coefficient (R) of -0.053 and weighted average of $121,444. Similarly, the statistical analysis conducted on geographies consisting of 126,382,514 people shows a mild negative correlation between the proportion of Maltese and household income with householder between the ages 45 and 64 in the United States with a correlation coefficient (R) of -0.301 and weighted average of $114,754, a difference of 5.8%.
Householder Income Ages 45 - 64 years Correlation Summary
| Measurement | Burmese | Maltese |
| Minimum | $18,640 | $13,981 |
| Maximum | $250,001 | $185,467 |
| Range | $231,361 | $171,486 |
| Mean | $141,791 | $115,766 |
| Median | $138,461 | $117,344 |
| Interquartile 25% (IQ1) | $113,099 | $107,547 |
| Interquartile 75% (IQ3) | $160,979 | $125,345 |
| Interquartile Range (IQR) | $47,880 | $17,798 |
| Standard Deviation (Sample) | $48,701 | $28,044 |
| Standard Deviation (Population) | $48,379 | $27,700 |
Demographics Similar to Burmese and Maltese by Householder Income Ages 45 - 64 years
In terms of householder income ages 45 - 64 years, the demographic groups most similar to Burmese are Immigrants from Korea ($121,243, a difference of 0.17%), Eastern European ($120,684, a difference of 0.63%), Immigrants from Australia ($119,308, a difference of 1.8%), Immigrants from Sri Lanka ($119,094, a difference of 2.0%), and Immigrants from Belgium ($118,932, a difference of 2.1%). Similarly, the demographic groups most similar to Maltese are Immigrants from Switzerland ($115,934, a difference of 1.0%), Latvian ($115,957, a difference of 1.1%), Immigrants from Denmark ($116,000, a difference of 1.1%), Chinese ($116,156, a difference of 1.2%), and Russian ($116,328, a difference of 1.4%).
| Demographics | Rating | Rank | Householder Income Ages 45 - 64 years |
| Burmese | 100.0 /100 | #17 | Exceptional $121,444 |
| Immigrants | Korea | 100.0 /100 | #18 | Exceptional $121,243 |
| Eastern Europeans | 100.0 /100 | #19 | Exceptional $120,684 |
| Immigrants | Australia | 100.0 /100 | #20 | Exceptional $119,308 |
| Immigrants | Sri Lanka | 100.0 /100 | #21 | Exceptional $119,094 |
| Immigrants | Belgium | 100.0 /100 | #22 | Exceptional $118,932 |
| Bolivians | 100.0 /100 | #23 | Exceptional $118,871 |
| Immigrants | Japan | 100.0 /100 | #24 | Exceptional $118,498 |
| Asians | 100.0 /100 | #25 | Exceptional $118,426 |
| Immigrants | Sweden | 100.0 /100 | #26 | Exceptional $118,318 |
| Immigrants | Northern Europe | 100.0 /100 | #27 | Exceptional $117,930 |
| Turks | 100.0 /100 | #28 | Exceptional $117,814 |
| Bhutanese | 100.0 /100 | #29 | Exceptional $117,750 |
| Immigrants | Bolivia | 100.0 /100 | #30 | Exceptional $117,731 |
| Immigrants | Asia | 100.0 /100 | #31 | Exceptional $116,566 |
| Russians | 100.0 /100 | #32 | Exceptional $116,328 |
| Chinese | 100.0 /100 | #33 | Exceptional $116,156 |
| Immigrants | Denmark | 100.0 /100 | #34 | Exceptional $116,000 |
| Latvians | 100.0 /100 | #35 | Exceptional $115,957 |
| Immigrants | Switzerland | 100.0 /100 | #36 | Exceptional $115,934 |
| Maltese | 99.9 /100 | #37 | Exceptional $114,754 |