Immigrants from Belgium vs Armenian Householder Income Ages 45 - 64 years
COMPARE
Immigrants from Belgium
Armenian
Householder Income Ages 45 - 64 years
Householder Income Ages 45 - 64 years Comparison
Immigrants from Belgium
Armenians
$118,932
HOUSEHOLDER INCOME AGES 45 - 64 YEARS
100.0/ 100
METRIC RATING
22nd/ 347
METRIC RANK
$107,002
HOUSEHOLDER INCOME AGES 45 - 64 YEARS
96.6/ 100
METRIC RATING
106th/ 347
METRIC RANK
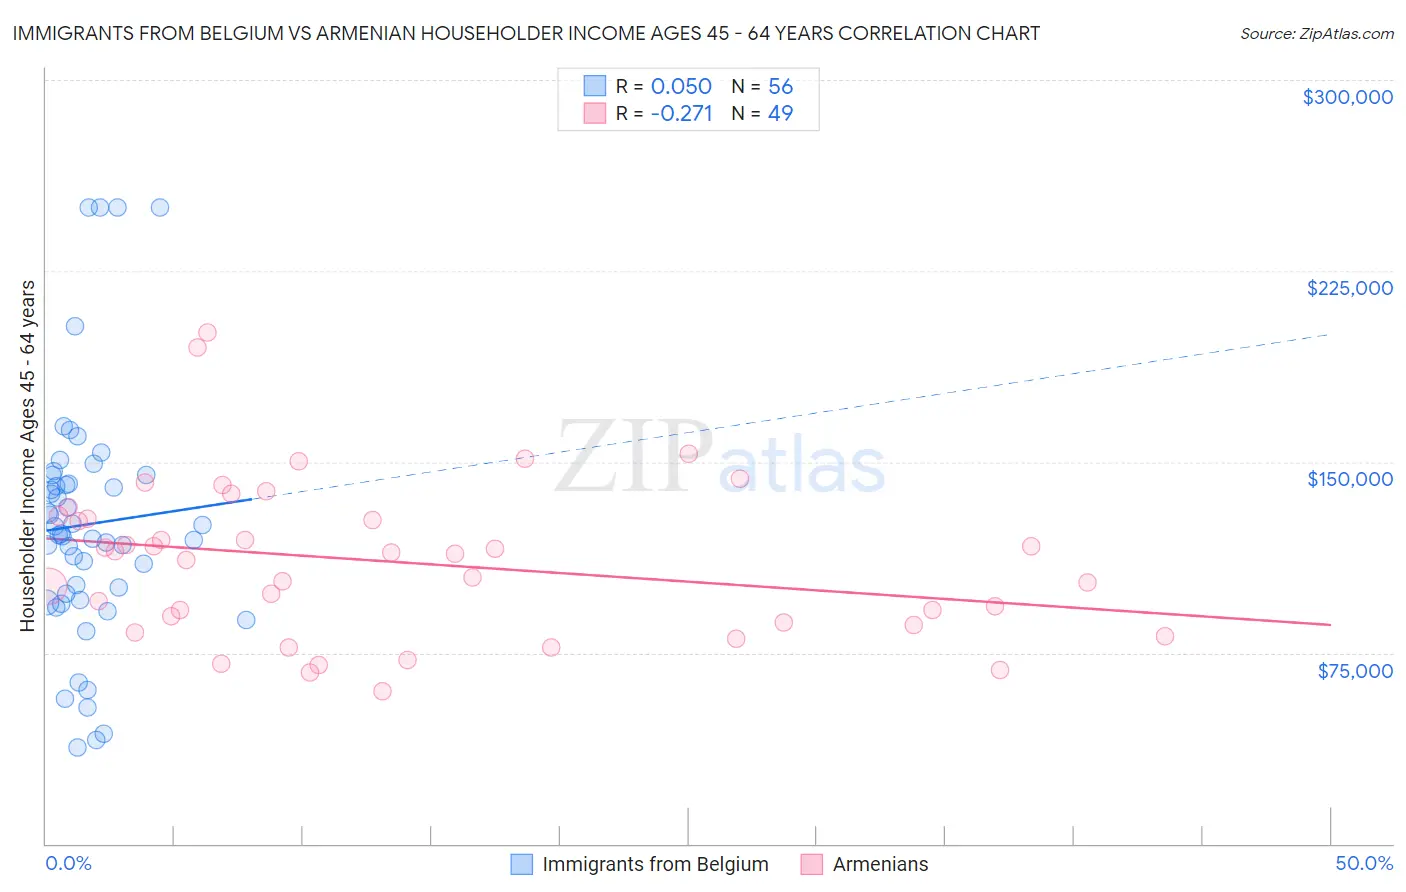
Immigrants from Belgium vs Armenian Householder Income Ages 45 - 64 years Correlation Chart
The statistical analysis conducted on geographies consisting of 146,611,057 people shows a slight positive correlation between the proportion of Immigrants from Belgium and household income with householder between the ages 45 and 64 in the United States with a correlation coefficient (R) of 0.050 and weighted average of $118,932. Similarly, the statistical analysis conducted on geographies consisting of 310,526,639 people shows a weak negative correlation between the proportion of Armenians and household income with householder between the ages 45 and 64 in the United States with a correlation coefficient (R) of -0.271 and weighted average of $107,002, a difference of 11.2%.
Householder Income Ages 45 - 64 years Correlation Summary
| Measurement | Immigrants from Belgium | Armenian |
| Minimum | $38,026 | $60,000 |
| Maximum | $250,001 | $200,625 |
| Range | $211,975 | $140,625 |
| Mean | $125,440 | $110,676 |
| Median | $121,589 | $113,807 |
| Interquartile 25% (IQ1) | $96,886 | $86,427 |
| Interquartile 75% (IQ3) | $142,973 | $128,076 |
| Interquartile Range (IQR) | $46,087 | $41,649 |
| Standard Deviation (Sample) | $48,145 | $30,867 |
| Standard Deviation (Population) | $47,713 | $30,551 |
Similar Demographics by Householder Income Ages 45 - 64 years
Demographics Similar to Immigrants from Belgium by Householder Income Ages 45 - 64 years
In terms of householder income ages 45 - 64 years, the demographic groups most similar to Immigrants from Belgium are Bolivian ($118,871, a difference of 0.050%), Immigrants from Sri Lanka ($119,094, a difference of 0.14%), Immigrants from Australia ($119,308, a difference of 0.32%), Immigrants from Japan ($118,498, a difference of 0.37%), and Asian ($118,426, a difference of 0.43%).
| Demographics | Rating | Rank | Householder Income Ages 45 - 64 years |
| Immigrants | Eastern Asia | 100.0 /100 | #15 | Exceptional $122,222 |
| Immigrants | China | 100.0 /100 | #16 | Exceptional $122,178 |
| Burmese | 100.0 /100 | #17 | Exceptional $121,444 |
| Immigrants | Korea | 100.0 /100 | #18 | Exceptional $121,243 |
| Eastern Europeans | 100.0 /100 | #19 | Exceptional $120,684 |
| Immigrants | Australia | 100.0 /100 | #20 | Exceptional $119,308 |
| Immigrants | Sri Lanka | 100.0 /100 | #21 | Exceptional $119,094 |
| Immigrants | Belgium | 100.0 /100 | #22 | Exceptional $118,932 |
| Bolivians | 100.0 /100 | #23 | Exceptional $118,871 |
| Immigrants | Japan | 100.0 /100 | #24 | Exceptional $118,498 |
| Asians | 100.0 /100 | #25 | Exceptional $118,426 |
| Immigrants | Sweden | 100.0 /100 | #26 | Exceptional $118,318 |
| Immigrants | Northern Europe | 100.0 /100 | #27 | Exceptional $117,930 |
| Turks | 100.0 /100 | #28 | Exceptional $117,814 |
| Bhutanese | 100.0 /100 | #29 | Exceptional $117,750 |
Demographics Similar to Armenians by Householder Income Ages 45 - 64 years
In terms of householder income ages 45 - 64 years, the demographic groups most similar to Armenians are Immigrants from Fiji ($106,952, a difference of 0.050%), Immigrants from Ukraine ($107,079, a difference of 0.070%), Macedonian ($107,074, a difference of 0.070%), Zimbabwean ($106,849, a difference of 0.14%), and Syrian ($107,207, a difference of 0.19%).
| Demographics | Rating | Rank | Householder Income Ages 45 - 64 years |
| Palestinians | 97.6 /100 | #99 | Exceptional $107,721 |
| Immigrants | Serbia | 97.4 /100 | #100 | Exceptional $107,569 |
| Immigrants | Kazakhstan | 97.2 /100 | #101 | Exceptional $107,378 |
| Immigrants | Moldova | 97.1 /100 | #102 | Exceptional $107,357 |
| Syrians | 96.9 /100 | #103 | Exceptional $107,207 |
| Immigrants | Ukraine | 96.7 /100 | #104 | Exceptional $107,079 |
| Macedonians | 96.7 /100 | #105 | Exceptional $107,074 |
| Armenians | 96.6 /100 | #106 | Exceptional $107,002 |
| Immigrants | Fiji | 96.5 /100 | #107 | Exceptional $106,952 |
| Zimbabweans | 96.3 /100 | #108 | Exceptional $106,849 |
| Chileans | 95.9 /100 | #109 | Exceptional $106,611 |
| Immigrants | Brazil | 95.6 /100 | #110 | Exceptional $106,470 |
| Immigrants | Vietnam | 95.5 /100 | #111 | Exceptional $106,417 |
| Swedes | 95.4 /100 | #112 | Exceptional $106,377 |
| Europeans | 95.4 /100 | #113 | Exceptional $106,367 |