Iranian vs Armenian Householder Income Ages 45 - 64 years
COMPARE
Iranian
Armenian
Householder Income Ages 45 - 64 years
Householder Income Ages 45 - 64 years Comparison
Iranians
Armenians
$129,350
HOUSEHOLDER INCOME AGES 45 - 64 YEARS
100.0/ 100
METRIC RATING
6th/ 347
METRIC RANK
$107,002
HOUSEHOLDER INCOME AGES 45 - 64 YEARS
96.6/ 100
METRIC RATING
106th/ 347
METRIC RANK
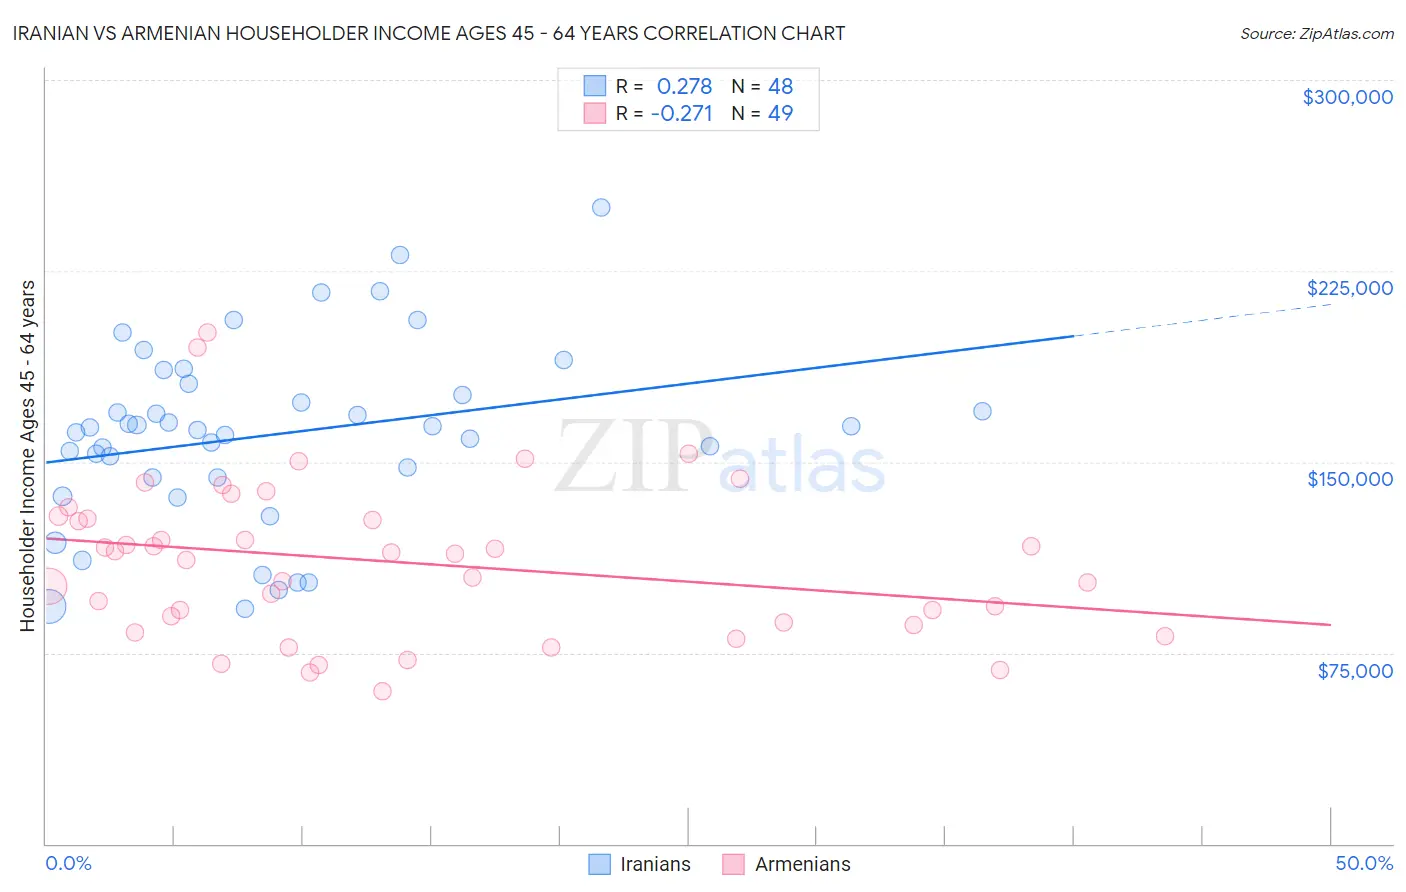
Iranian vs Armenian Householder Income Ages 45 - 64 years Correlation Chart
The statistical analysis conducted on geographies consisting of 316,454,523 people shows a weak positive correlation between the proportion of Iranians and household income with householder between the ages 45 and 64 in the United States with a correlation coefficient (R) of 0.278 and weighted average of $129,350. Similarly, the statistical analysis conducted on geographies consisting of 310,526,639 people shows a weak negative correlation between the proportion of Armenians and household income with householder between the ages 45 and 64 in the United States with a correlation coefficient (R) of -0.271 and weighted average of $107,002, a difference of 20.9%.
Householder Income Ages 45 - 64 years Correlation Summary
| Measurement | Iranian | Armenian |
| Minimum | $92,091 | $60,000 |
| Maximum | $250,001 | $200,625 |
| Range | $157,910 | $140,625 |
| Mean | $160,647 | $110,676 |
| Median | $162,915 | $113,807 |
| Interquartile 25% (IQ1) | $143,809 | $86,427 |
| Interquartile 75% (IQ3) | $178,661 | $128,076 |
| Interquartile Range (IQR) | $34,851 | $41,649 |
| Standard Deviation (Sample) | $35,600 | $30,867 |
| Standard Deviation (Population) | $35,228 | $30,551 |
Similar Demographics by Householder Income Ages 45 - 64 years
Demographics Similar to Iranians by Householder Income Ages 45 - 64 years
In terms of householder income ages 45 - 64 years, the demographic groups most similar to Iranians are Immigrants from Singapore ($129,514, a difference of 0.13%), Thai ($129,560, a difference of 0.16%), Immigrants from Hong Kong ($127,500, a difference of 1.5%), Immigrants from Iran ($126,940, a difference of 1.9%), and Immigrants from India ($132,488, a difference of 2.4%).
| Demographics | Rating | Rank | Householder Income Ages 45 - 64 years |
| Immigrants | Taiwan | 100.0 /100 | #1 | Exceptional $135,508 |
| Filipinos | 100.0 /100 | #2 | Exceptional $134,910 |
| Immigrants | India | 100.0 /100 | #3 | Exceptional $132,488 |
| Thais | 100.0 /100 | #4 | Exceptional $129,560 |
| Immigrants | Singapore | 100.0 /100 | #5 | Exceptional $129,514 |
| Iranians | 100.0 /100 | #6 | Exceptional $129,350 |
| Immigrants | Hong Kong | 100.0 /100 | #7 | Exceptional $127,500 |
| Immigrants | Iran | 100.0 /100 | #8 | Exceptional $126,940 |
| Okinawans | 100.0 /100 | #9 | Exceptional $124,796 |
| Immigrants | South Central Asia | 100.0 /100 | #10 | Exceptional $124,188 |
| Cypriots | 100.0 /100 | #11 | Exceptional $123,396 |
| Immigrants | Israel | 100.0 /100 | #12 | Exceptional $122,893 |
| Immigrants | Ireland | 100.0 /100 | #13 | Exceptional $122,757 |
| Indians (Asian) | 100.0 /100 | #14 | Exceptional $122,343 |
| Immigrants | Eastern Asia | 100.0 /100 | #15 | Exceptional $122,222 |
Demographics Similar to Armenians by Householder Income Ages 45 - 64 years
In terms of householder income ages 45 - 64 years, the demographic groups most similar to Armenians are Immigrants from Fiji ($106,952, a difference of 0.050%), Immigrants from Ukraine ($107,079, a difference of 0.070%), Macedonian ($107,074, a difference of 0.070%), Zimbabwean ($106,849, a difference of 0.14%), and Syrian ($107,207, a difference of 0.19%).
| Demographics | Rating | Rank | Householder Income Ages 45 - 64 years |
| Palestinians | 97.6 /100 | #99 | Exceptional $107,721 |
| Immigrants | Serbia | 97.4 /100 | #100 | Exceptional $107,569 |
| Immigrants | Kazakhstan | 97.2 /100 | #101 | Exceptional $107,378 |
| Immigrants | Moldova | 97.1 /100 | #102 | Exceptional $107,357 |
| Syrians | 96.9 /100 | #103 | Exceptional $107,207 |
| Immigrants | Ukraine | 96.7 /100 | #104 | Exceptional $107,079 |
| Macedonians | 96.7 /100 | #105 | Exceptional $107,074 |
| Armenians | 96.6 /100 | #106 | Exceptional $107,002 |
| Immigrants | Fiji | 96.5 /100 | #107 | Exceptional $106,952 |
| Zimbabweans | 96.3 /100 | #108 | Exceptional $106,849 |
| Chileans | 95.9 /100 | #109 | Exceptional $106,611 |
| Immigrants | Brazil | 95.6 /100 | #110 | Exceptional $106,470 |
| Immigrants | Vietnam | 95.5 /100 | #111 | Exceptional $106,417 |
| Swedes | 95.4 /100 | #112 | Exceptional $106,377 |
| Europeans | 95.4 /100 | #113 | Exceptional $106,367 |