Ghanaian vs Armenian Householder Income Ages 45 - 64 years
COMPARE
Ghanaian
Armenian
Householder Income Ages 45 - 64 years
Householder Income Ages 45 - 64 years Comparison
Ghanaians
Armenians
$97,277
HOUSEHOLDER INCOME AGES 45 - 64 YEARS
17.9/ 100
METRIC RATING
207th/ 347
METRIC RANK
$107,002
HOUSEHOLDER INCOME AGES 45 - 64 YEARS
96.6/ 100
METRIC RATING
106th/ 347
METRIC RANK
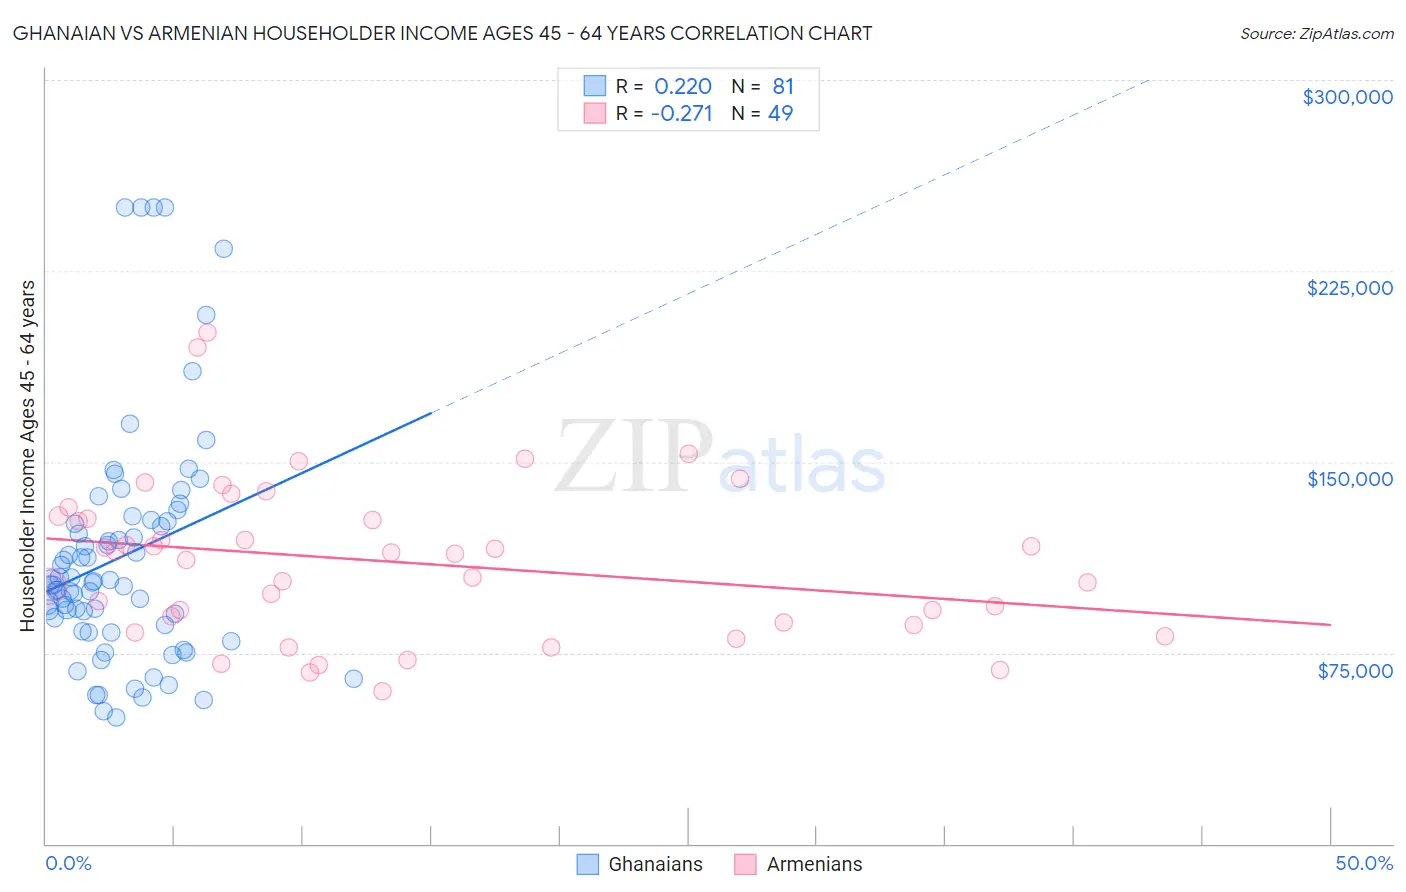
Ghanaian vs Armenian Householder Income Ages 45 - 64 years Correlation Chart
The statistical analysis conducted on geographies consisting of 190,434,757 people shows a weak positive correlation between the proportion of Ghanaians and household income with householder between the ages 45 and 64 in the United States with a correlation coefficient (R) of 0.220 and weighted average of $97,277. Similarly, the statistical analysis conducted on geographies consisting of 310,526,639 people shows a weak negative correlation between the proportion of Armenians and household income with householder between the ages 45 and 64 in the United States with a correlation coefficient (R) of -0.271 and weighted average of $107,002, a difference of 10.0%.
Householder Income Ages 45 - 64 years Correlation Summary
| Measurement | Ghanaian | Armenian |
| Minimum | $49,787 | $60,000 |
| Maximum | $250,001 | $200,625 |
| Range | $200,214 | $140,625 |
| Mean | $112,590 | $110,676 |
| Median | $102,711 | $113,807 |
| Interquartile 25% (IQ1) | $84,781 | $86,427 |
| Interquartile 75% (IQ3) | $126,915 | $128,076 |
| Interquartile Range (IQR) | $42,134 | $41,649 |
| Standard Deviation (Sample) | $45,701 | $30,867 |
| Standard Deviation (Population) | $45,418 | $30,551 |
Similar Demographics by Householder Income Ages 45 - 64 years
Demographics Similar to Ghanaians by Householder Income Ages 45 - 64 years
In terms of householder income ages 45 - 64 years, the demographic groups most similar to Ghanaians are Immigrants from Colombia ($97,290, a difference of 0.010%), Immigrants from Africa ($97,284, a difference of 0.010%), Immigrants from Eritrea ($97,373, a difference of 0.10%), Immigrants from Thailand ($97,400, a difference of 0.13%), and Tlingit-Haida ($97,417, a difference of 0.14%).
| Demographics | Rating | Rank | Householder Income Ages 45 - 64 years |
| Immigrants | Kenya | 23.5 /100 | #200 | Fair $97,964 |
| Yugoslavians | 20.0 /100 | #201 | Fair $97,558 |
| Tlingit-Haida | 18.9 /100 | #202 | Poor $97,417 |
| Immigrants | Thailand | 18.8 /100 | #203 | Poor $97,400 |
| Immigrants | Eritrea | 18.6 /100 | #204 | Poor $97,373 |
| Immigrants | Colombia | 18.0 /100 | #205 | Poor $97,290 |
| Immigrants | Africa | 17.9 /100 | #206 | Poor $97,284 |
| Ghanaians | 17.9 /100 | #207 | Poor $97,277 |
| Scotch-Irish | 16.4 /100 | #208 | Poor $97,073 |
| Japanese | 14.8 /100 | #209 | Poor $96,834 |
| Tsimshian | 14.5 /100 | #210 | Poor $96,783 |
| Immigrants | Cambodia | 13.0 /100 | #211 | Poor $96,537 |
| Venezuelans | 12.6 /100 | #212 | Poor $96,460 |
| Immigrants | Uruguay | 10.7 /100 | #213 | Poor $96,086 |
| Panamanians | 10.6 /100 | #214 | Poor $96,066 |
Demographics Similar to Armenians by Householder Income Ages 45 - 64 years
In terms of householder income ages 45 - 64 years, the demographic groups most similar to Armenians are Immigrants from Fiji ($106,952, a difference of 0.050%), Immigrants from Ukraine ($107,079, a difference of 0.070%), Macedonian ($107,074, a difference of 0.070%), Zimbabwean ($106,849, a difference of 0.14%), and Syrian ($107,207, a difference of 0.19%).
| Demographics | Rating | Rank | Householder Income Ages 45 - 64 years |
| Palestinians | 97.6 /100 | #99 | Exceptional $107,721 |
| Immigrants | Serbia | 97.4 /100 | #100 | Exceptional $107,569 |
| Immigrants | Kazakhstan | 97.2 /100 | #101 | Exceptional $107,378 |
| Immigrants | Moldova | 97.1 /100 | #102 | Exceptional $107,357 |
| Syrians | 96.9 /100 | #103 | Exceptional $107,207 |
| Immigrants | Ukraine | 96.7 /100 | #104 | Exceptional $107,079 |
| Macedonians | 96.7 /100 | #105 | Exceptional $107,074 |
| Armenians | 96.6 /100 | #106 | Exceptional $107,002 |
| Immigrants | Fiji | 96.5 /100 | #107 | Exceptional $106,952 |
| Zimbabweans | 96.3 /100 | #108 | Exceptional $106,849 |
| Chileans | 95.9 /100 | #109 | Exceptional $106,611 |
| Immigrants | Brazil | 95.6 /100 | #110 | Exceptional $106,470 |
| Immigrants | Vietnam | 95.5 /100 | #111 | Exceptional $106,417 |
| Swedes | 95.4 /100 | #112 | Exceptional $106,377 |
| Europeans | 95.4 /100 | #113 | Exceptional $106,367 |