Colombian vs Central American Indian Median Household Income
COMPARE
Colombian
Central American Indian
Median Household Income
Median Household Income Comparison
Colombians
Central American Indians
$85,716
MEDIAN HOUSEHOLD INCOME
59.7/ 100
METRIC RATING
169th/ 347
METRIC RANK
$74,847
MEDIAN HOUSEHOLD INCOME
0.1/ 100
METRIC RATING
282nd/ 347
METRIC RANK
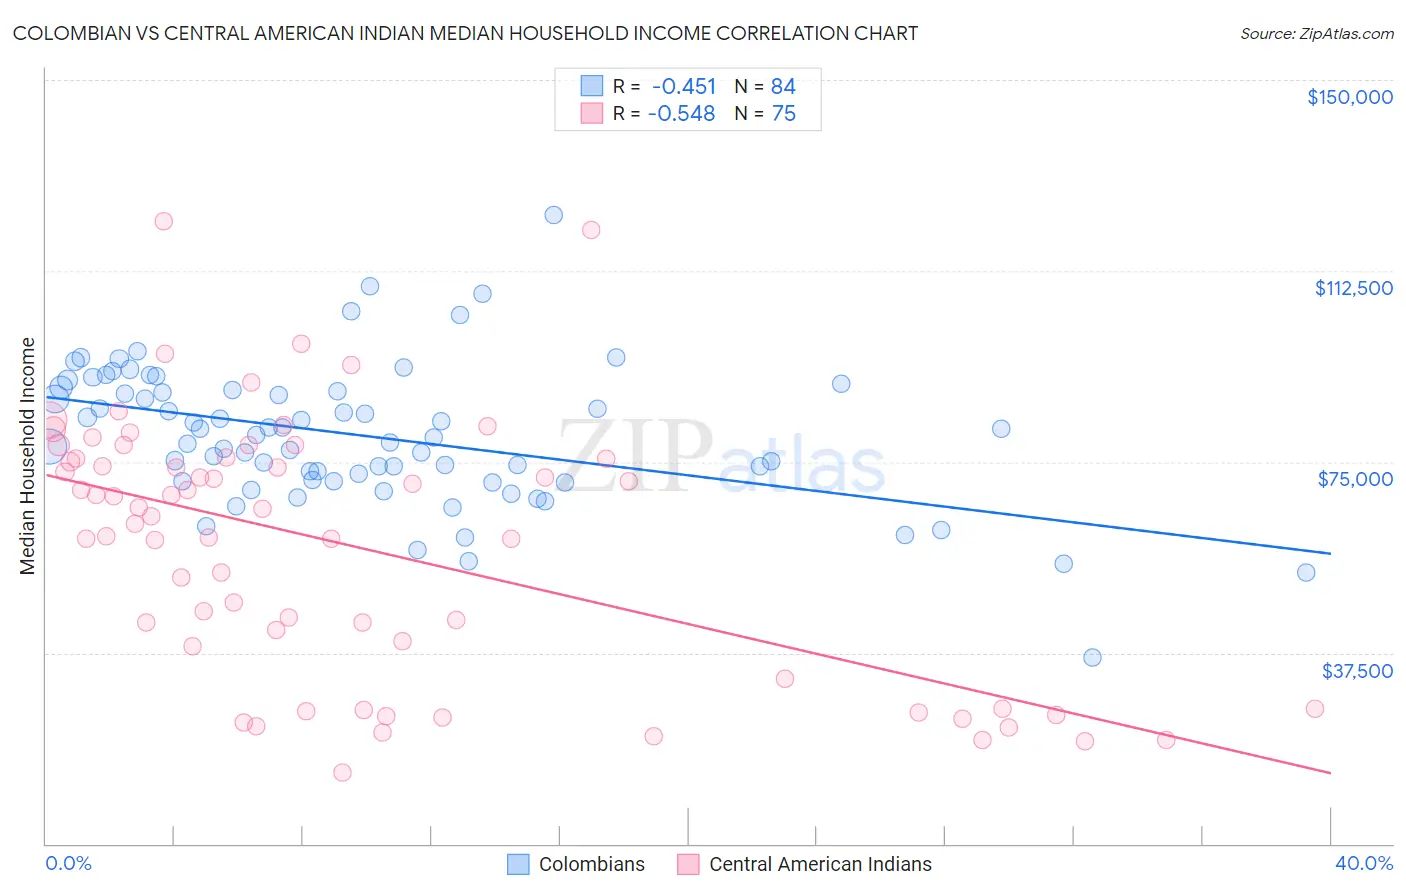
Colombian vs Central American Indian Median Household Income Correlation Chart
The statistical analysis conducted on geographies consisting of 419,147,971 people shows a moderate negative correlation between the proportion of Colombians and median household income in the United States with a correlation coefficient (R) of -0.451 and weighted average of $85,716. Similarly, the statistical analysis conducted on geographies consisting of 326,011,842 people shows a substantial negative correlation between the proportion of Central American Indians and median household income in the United States with a correlation coefficient (R) of -0.548 and weighted average of $74,847, a difference of 14.5%.
Median Household Income Correlation Summary
| Measurement | Colombian | Central American Indian |
| Minimum | $36,563 | $14,073 |
| Maximum | $123,534 | $122,237 |
| Range | $86,971 | $108,164 |
| Mean | $80,109 | $58,298 |
| Median | $80,054 | $64,310 |
| Interquartile 25% (IQ1) | $71,412 | $32,456 |
| Interquartile 75% (IQ3) | $89,021 | $75,688 |
| Interquartile Range (IQR) | $17,609 | $43,232 |
| Standard Deviation (Sample) | $13,777 | $25,417 |
| Standard Deviation (Population) | $13,694 | $25,247 |
Similar Demographics by Median Household Income
Demographics Similar to Colombians by Median Household Income
In terms of median household income, the demographic groups most similar to Colombians are Swiss ($85,681, a difference of 0.040%), Icelander ($85,797, a difference of 0.090%), Immigrants ($85,818, a difference of 0.12%), Immigrants from South America ($85,611, a difference of 0.12%), and Slovene ($85,562, a difference of 0.18%).
| Demographics | Rating | Rank | Median Household Income |
| Guamanians/Chamorros | 67.7 /100 | #162 | Good $86,255 |
| Czechs | 66.4 /100 | #163 | Good $86,164 |
| Irish | 66.2 /100 | #164 | Good $86,145 |
| Norwegians | 65.3 /100 | #165 | Good $86,084 |
| Scandinavians | 65.1 /100 | #166 | Good $86,073 |
| Immigrants | Immigrants | 61.3 /100 | #167 | Good $85,818 |
| Icelanders | 61.0 /100 | #168 | Good $85,797 |
| Colombians | 59.7 /100 | #169 | Average $85,716 |
| Swiss | 59.2 /100 | #170 | Average $85,681 |
| Immigrants | South America | 58.1 /100 | #171 | Average $85,611 |
| Slovenes | 57.4 /100 | #172 | Average $85,562 |
| Immigrants | Cameroon | 53.4 /100 | #173 | Average $85,314 |
| Scottish | 50.0 /100 | #174 | Average $85,101 |
| Immigrants | Costa Rica | 49.2 /100 | #175 | Average $85,054 |
| Alsatians | 49.2 /100 | #176 | Average $85,053 |
Demographics Similar to Central American Indians by Median Household Income
In terms of median household income, the demographic groups most similar to Central American Indians are Immigrants from Liberia ($74,896, a difference of 0.070%), Senegalese ($74,999, a difference of 0.20%), Cree ($74,685, a difference of 0.22%), Yaqui ($74,596, a difference of 0.34%), and Immigrants from Guatemala ($75,123, a difference of 0.37%).
| Demographics | Rating | Rank | Median Household Income |
| Immigrants | Micronesia | 0.2 /100 | #275 | Tragic $75,574 |
| Immigrants | Latin America | 0.2 /100 | #276 | Tragic $75,420 |
| Spanish Americans | 0.2 /100 | #277 | Tragic $75,386 |
| Osage | 0.2 /100 | #278 | Tragic $75,240 |
| Immigrants | Guatemala | 0.2 /100 | #279 | Tragic $75,123 |
| Senegalese | 0.2 /100 | #280 | Tragic $74,999 |
| Immigrants | Liberia | 0.1 /100 | #281 | Tragic $74,896 |
| Central American Indians | 0.1 /100 | #282 | Tragic $74,847 |
| Cree | 0.1 /100 | #283 | Tragic $74,685 |
| Yaqui | 0.1 /100 | #284 | Tragic $74,596 |
| Mexicans | 0.1 /100 | #285 | Tragic $74,399 |
| Immigrants | Somalia | 0.1 /100 | #286 | Tragic $74,300 |
| Iroquois | 0.1 /100 | #287 | Tragic $74,279 |
| Immigrants | Central America | 0.1 /100 | #288 | Tragic $74,217 |
| Fijians | 0.1 /100 | #289 | Tragic $74,205 |