Colombian vs Immigrants from Uruguay Median Household Income
COMPARE
Colombian
Immigrants from Uruguay
Median Household Income
Median Household Income Comparison
Colombians
Immigrants from Uruguay
$85,716
MEDIAN HOUSEHOLD INCOME
59.7/ 100
METRIC RATING
169th/ 347
METRIC RANK
$82,560
MEDIAN HOUSEHOLD INCOME
16.4/ 100
METRIC RATING
210th/ 347
METRIC RANK
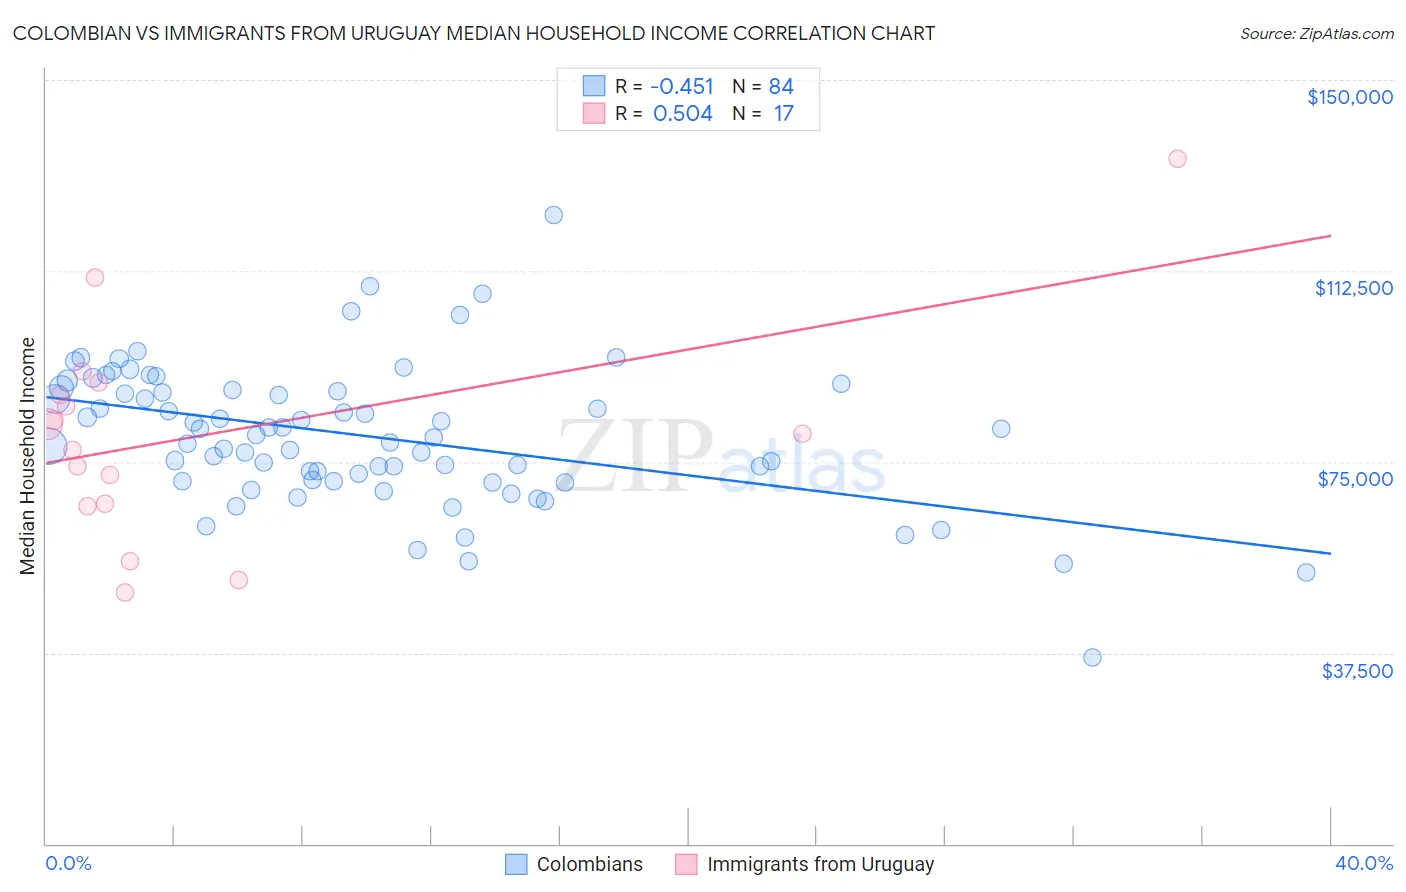
Colombian vs Immigrants from Uruguay Median Household Income Correlation Chart
The statistical analysis conducted on geographies consisting of 419,147,971 people shows a moderate negative correlation between the proportion of Colombians and median household income in the United States with a correlation coefficient (R) of -0.451 and weighted average of $85,716. Similarly, the statistical analysis conducted on geographies consisting of 133,237,976 people shows a substantial positive correlation between the proportion of Immigrants from Uruguay and median household income in the United States with a correlation coefficient (R) of 0.504 and weighted average of $82,560, a difference of 3.8%.
Median Household Income Correlation Summary
| Measurement | Colombian | Immigrants from Uruguay |
| Minimum | $36,563 | $49,241 |
| Maximum | $123,534 | $134,635 |
| Range | $86,971 | $85,394 |
| Mean | $80,109 | $80,181 |
| Median | $80,054 | $80,417 |
| Interquartile 25% (IQ1) | $71,412 | $66,523 |
| Interquartile 75% (IQ3) | $89,021 | $89,275 |
| Interquartile Range (IQR) | $17,609 | $22,752 |
| Standard Deviation (Sample) | $13,777 | $21,157 |
| Standard Deviation (Population) | $13,694 | $20,525 |
Similar Demographics by Median Household Income
Demographics Similar to Colombians by Median Household Income
In terms of median household income, the demographic groups most similar to Colombians are Swiss ($85,681, a difference of 0.040%), Icelander ($85,797, a difference of 0.090%), Immigrants ($85,818, a difference of 0.12%), Immigrants from South America ($85,611, a difference of 0.12%), and Slovene ($85,562, a difference of 0.18%).
| Demographics | Rating | Rank | Median Household Income |
| Guamanians/Chamorros | 67.7 /100 | #162 | Good $86,255 |
| Czechs | 66.4 /100 | #163 | Good $86,164 |
| Irish | 66.2 /100 | #164 | Good $86,145 |
| Norwegians | 65.3 /100 | #165 | Good $86,084 |
| Scandinavians | 65.1 /100 | #166 | Good $86,073 |
| Immigrants | Immigrants | 61.3 /100 | #167 | Good $85,818 |
| Icelanders | 61.0 /100 | #168 | Good $85,797 |
| Colombians | 59.7 /100 | #169 | Average $85,716 |
| Swiss | 59.2 /100 | #170 | Average $85,681 |
| Immigrants | South America | 58.1 /100 | #171 | Average $85,611 |
| Slovenes | 57.4 /100 | #172 | Average $85,562 |
| Immigrants | Cameroon | 53.4 /100 | #173 | Average $85,314 |
| Scottish | 50.0 /100 | #174 | Average $85,101 |
| Immigrants | Costa Rica | 49.2 /100 | #175 | Average $85,054 |
| Alsatians | 49.2 /100 | #176 | Average $85,053 |
Demographics Similar to Immigrants from Uruguay by Median Household Income
In terms of median household income, the demographic groups most similar to Immigrants from Uruguay are Immigrants from Iraq ($82,594, a difference of 0.040%), Salvadoran ($82,449, a difference of 0.14%), Venezuelan ($82,432, a difference of 0.16%), Nepalese ($82,410, a difference of 0.18%), and French Canadian ($82,810, a difference of 0.30%).
| Demographics | Rating | Rank | Median Household Income |
| Immigrants | Cambodia | 24.0 /100 | #203 | Fair $83,304 |
| Immigrants | Africa | 23.8 /100 | #204 | Fair $83,289 |
| Celtics | 22.7 /100 | #205 | Fair $83,193 |
| Immigrants | Kenya | 21.3 /100 | #206 | Fair $83,068 |
| Dutch | 20.3 /100 | #207 | Fair $82,971 |
| French Canadians | 18.7 /100 | #208 | Poor $82,810 |
| Immigrants | Iraq | 16.7 /100 | #209 | Poor $82,594 |
| Immigrants | Uruguay | 16.4 /100 | #210 | Poor $82,560 |
| Salvadorans | 15.4 /100 | #211 | Poor $82,449 |
| Venezuelans | 15.3 /100 | #212 | Poor $82,432 |
| Nepalese | 15.1 /100 | #213 | Poor $82,410 |
| Panamanians | 14.0 /100 | #214 | Poor $82,272 |
| Vietnamese | 13.8 /100 | #215 | Poor $82,248 |
| Yugoslavians | 13.3 /100 | #216 | Poor $82,186 |
| Ecuadorians | 12.5 /100 | #217 | Poor $82,070 |