Mongolian vs Central American Indian Median Household Income
COMPARE
Mongolian
Central American Indian
Median Household Income
Median Household Income Comparison
Mongolians
Central American Indians
$93,971
MEDIAN HOUSEHOLD INCOME
99.7/ 100
METRIC RATING
68th/ 347
METRIC RANK
$74,847
MEDIAN HOUSEHOLD INCOME
0.1/ 100
METRIC RATING
282nd/ 347
METRIC RANK
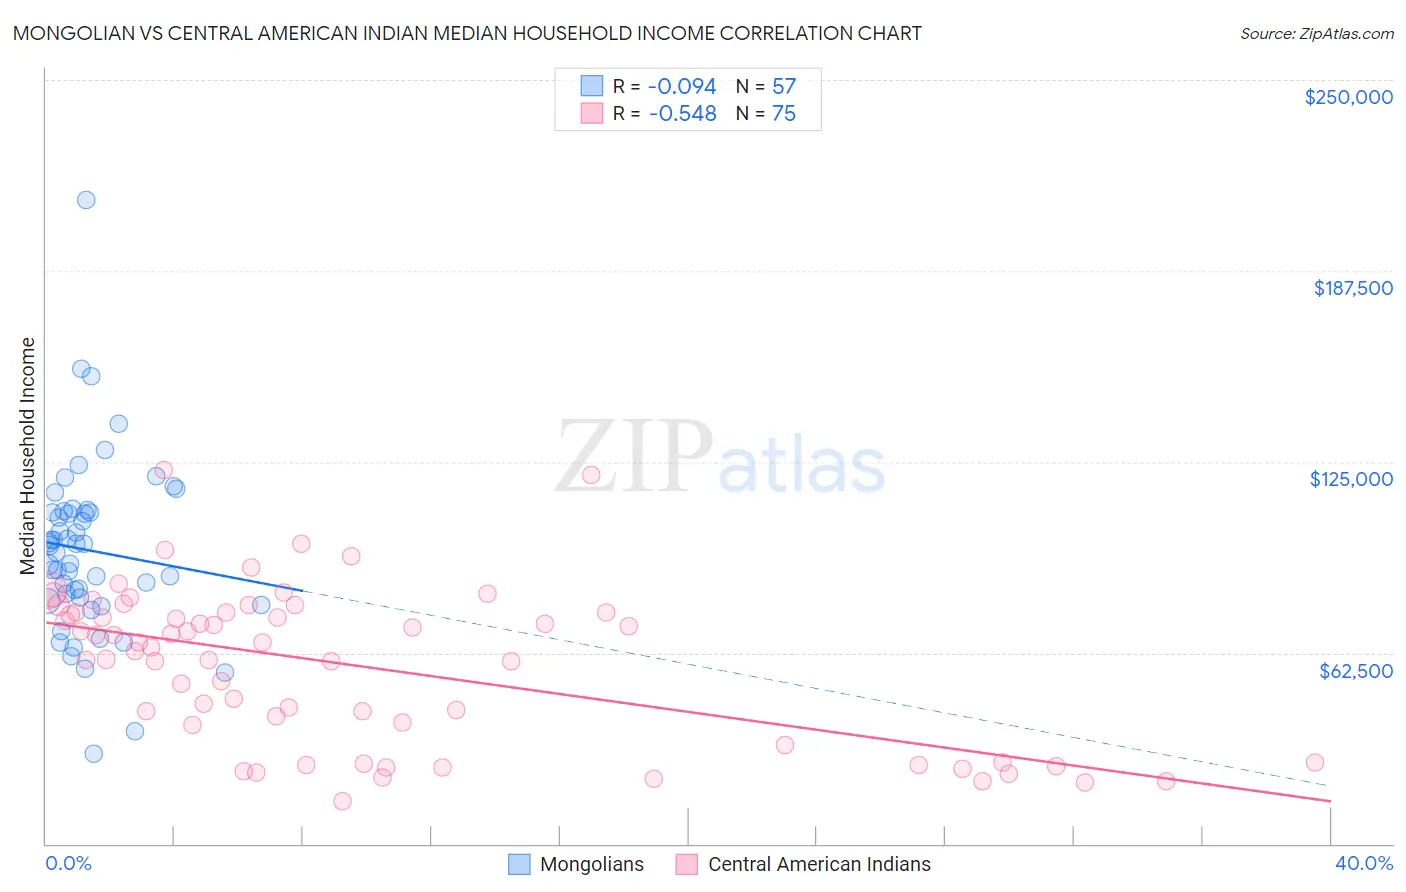
Mongolian vs Central American Indian Median Household Income Correlation Chart
The statistical analysis conducted on geographies consisting of 140,276,403 people shows a slight negative correlation between the proportion of Mongolians and median household income in the United States with a correlation coefficient (R) of -0.094 and weighted average of $93,971. Similarly, the statistical analysis conducted on geographies consisting of 326,011,842 people shows a substantial negative correlation between the proportion of Central American Indians and median household income in the United States with a correlation coefficient (R) of -0.548 and weighted average of $74,847, a difference of 25.6%.
Median Household Income Correlation Summary
| Measurement | Mongolian | Central American Indian |
| Minimum | $29,643 | $14,073 |
| Maximum | $210,785 | $122,237 |
| Range | $181,142 | $108,164 |
| Mean | $96,039 | $58,298 |
| Median | $97,648 | $64,310 |
| Interquartile 25% (IQ1) | $79,996 | $32,456 |
| Interquartile 75% (IQ3) | $108,680 | $75,688 |
| Interquartile Range (IQR) | $28,684 | $43,232 |
| Standard Deviation (Sample) | $28,830 | $25,417 |
| Standard Deviation (Population) | $28,576 | $25,247 |
Similar Demographics by Median Household Income
Demographics Similar to Mongolians by Median Household Income
In terms of median household income, the demographic groups most similar to Mongolians are Argentinean ($93,960, a difference of 0.010%), Immigrants from Fiji ($93,933, a difference of 0.040%), Immigrants from Philippines ($93,899, a difference of 0.080%), Immigrants from Scotland ($94,091, a difference of 0.13%), and Lithuanian ($93,852, a difference of 0.13%).
| Demographics | Rating | Rank | Median Household Income |
| Laotians | 99.8 /100 | #61 | Exceptional $94,990 |
| Immigrants | Norway | 99.8 /100 | #62 | Exceptional $94,846 |
| Greeks | 99.8 /100 | #63 | Exceptional $94,735 |
| Immigrants | Netherlands | 99.7 /100 | #64 | Exceptional $94,411 |
| Immigrants | Belarus | 99.7 /100 | #65 | Exceptional $94,399 |
| Immigrants | Romania | 99.7 /100 | #66 | Exceptional $94,222 |
| Immigrants | Scotland | 99.7 /100 | #67 | Exceptional $94,091 |
| Mongolians | 99.7 /100 | #68 | Exceptional $93,971 |
| Argentineans | 99.7 /100 | #69 | Exceptional $93,960 |
| Immigrants | Fiji | 99.7 /100 | #70 | Exceptional $93,933 |
| Immigrants | Philippines | 99.6 /100 | #71 | Exceptional $93,899 |
| Lithuanians | 99.6 /100 | #72 | Exceptional $93,852 |
| Immigrants | Egypt | 99.6 /100 | #73 | Exceptional $93,700 |
| Immigrants | Latvia | 99.6 /100 | #74 | Exceptional $93,602 |
| Immigrants | Italy | 99.5 /100 | #75 | Exceptional $93,465 |
Demographics Similar to Central American Indians by Median Household Income
In terms of median household income, the demographic groups most similar to Central American Indians are Immigrants from Liberia ($74,896, a difference of 0.070%), Senegalese ($74,999, a difference of 0.20%), Cree ($74,685, a difference of 0.22%), Yaqui ($74,596, a difference of 0.34%), and Immigrants from Guatemala ($75,123, a difference of 0.37%).
| Demographics | Rating | Rank | Median Household Income |
| Immigrants | Micronesia | 0.2 /100 | #275 | Tragic $75,574 |
| Immigrants | Latin America | 0.2 /100 | #276 | Tragic $75,420 |
| Spanish Americans | 0.2 /100 | #277 | Tragic $75,386 |
| Osage | 0.2 /100 | #278 | Tragic $75,240 |
| Immigrants | Guatemala | 0.2 /100 | #279 | Tragic $75,123 |
| Senegalese | 0.2 /100 | #280 | Tragic $74,999 |
| Immigrants | Liberia | 0.1 /100 | #281 | Tragic $74,896 |
| Central American Indians | 0.1 /100 | #282 | Tragic $74,847 |
| Cree | 0.1 /100 | #283 | Tragic $74,685 |
| Yaqui | 0.1 /100 | #284 | Tragic $74,596 |
| Mexicans | 0.1 /100 | #285 | Tragic $74,399 |
| Immigrants | Somalia | 0.1 /100 | #286 | Tragic $74,300 |
| Iroquois | 0.1 /100 | #287 | Tragic $74,279 |
| Immigrants | Central America | 0.1 /100 | #288 | Tragic $74,217 |
| Fijians | 0.1 /100 | #289 | Tragic $74,205 |