Colombian vs Immigrants from Australia Median Household Income
COMPARE
Colombian
Immigrants from Australia
Median Household Income
Median Household Income Comparison
Colombians
Immigrants from Australia
$85,716
MEDIAN HOUSEHOLD INCOME
59.7/ 100
METRIC RATING
169th/ 347
METRIC RANK
$102,562
MEDIAN HOUSEHOLD INCOME
100.0/ 100
METRIC RATING
19th/ 347
METRIC RANK
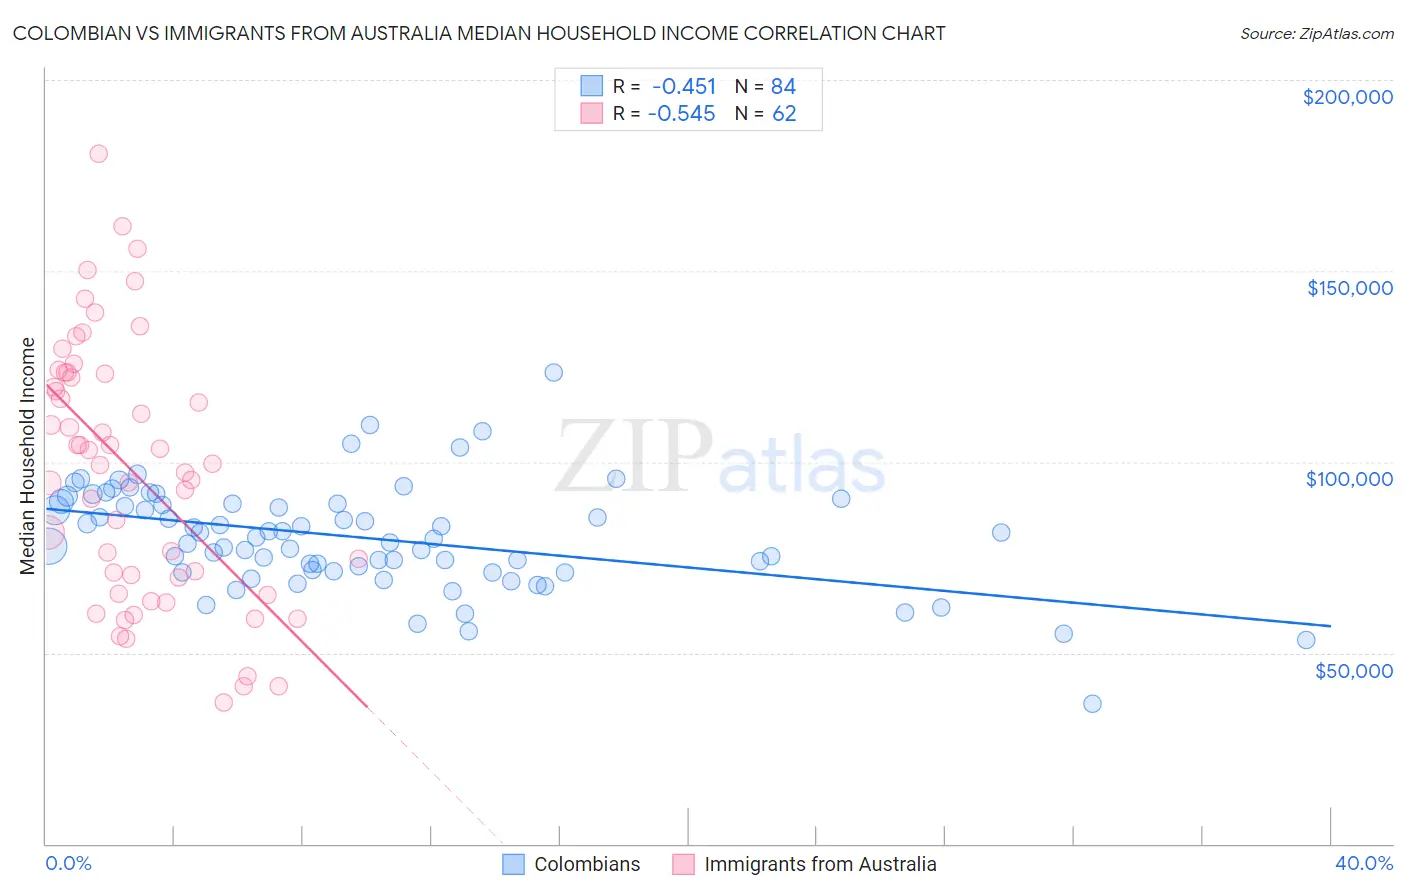
Colombian vs Immigrants from Australia Median Household Income Correlation Chart
The statistical analysis conducted on geographies consisting of 419,147,971 people shows a moderate negative correlation between the proportion of Colombians and median household income in the United States with a correlation coefficient (R) of -0.451 and weighted average of $85,716. Similarly, the statistical analysis conducted on geographies consisting of 227,116,578 people shows a substantial negative correlation between the proportion of Immigrants from Australia and median household income in the United States with a correlation coefficient (R) of -0.545 and weighted average of $102,562, a difference of 19.7%.
Median Household Income Correlation Summary
| Measurement | Colombian | Immigrants from Australia |
| Minimum | $36,563 | $36,932 |
| Maximum | $123,534 | $180,529 |
| Range | $86,971 | $143,597 |
| Mean | $80,109 | $97,516 |
| Median | $80,054 | $99,226 |
| Interquartile 25% (IQ1) | $71,412 | $69,750 |
| Interquartile 75% (IQ3) | $89,021 | $123,199 |
| Interquartile Range (IQR) | $17,609 | $53,449 |
| Standard Deviation (Sample) | $13,777 | $33,443 |
| Standard Deviation (Population) | $13,694 | $33,173 |
Similar Demographics by Median Household Income
Demographics Similar to Colombians by Median Household Income
In terms of median household income, the demographic groups most similar to Colombians are Swiss ($85,681, a difference of 0.040%), Icelander ($85,797, a difference of 0.090%), Immigrants ($85,818, a difference of 0.12%), Immigrants from South America ($85,611, a difference of 0.12%), and Slovene ($85,562, a difference of 0.18%).
| Demographics | Rating | Rank | Median Household Income |
| Guamanians/Chamorros | 67.7 /100 | #162 | Good $86,255 |
| Czechs | 66.4 /100 | #163 | Good $86,164 |
| Irish | 66.2 /100 | #164 | Good $86,145 |
| Norwegians | 65.3 /100 | #165 | Good $86,084 |
| Scandinavians | 65.1 /100 | #166 | Good $86,073 |
| Immigrants | Immigrants | 61.3 /100 | #167 | Good $85,818 |
| Icelanders | 61.0 /100 | #168 | Good $85,797 |
| Colombians | 59.7 /100 | #169 | Average $85,716 |
| Swiss | 59.2 /100 | #170 | Average $85,681 |
| Immigrants | South America | 58.1 /100 | #171 | Average $85,611 |
| Slovenes | 57.4 /100 | #172 | Average $85,562 |
| Immigrants | Cameroon | 53.4 /100 | #173 | Average $85,314 |
| Scottish | 50.0 /100 | #174 | Average $85,101 |
| Immigrants | Costa Rica | 49.2 /100 | #175 | Average $85,054 |
| Alsatians | 49.2 /100 | #176 | Average $85,053 |
Demographics Similar to Immigrants from Australia by Median Household Income
In terms of median household income, the demographic groups most similar to Immigrants from Australia are Cypriot ($102,843, a difference of 0.27%), Bolivian ($102,195, a difference of 0.36%), Immigrants from Korea ($102,962, a difference of 0.39%), Burmese ($103,145, a difference of 0.57%), and Eastern European ($101,781, a difference of 0.77%).
| Demographics | Rating | Rank | Median Household Income |
| Indians (Asian) | 100.0 /100 | #12 | Exceptional $105,262 |
| Immigrants | Eastern Asia | 100.0 /100 | #13 | Exceptional $104,796 |
| Immigrants | Ireland | 100.0 /100 | #14 | Exceptional $104,692 |
| Immigrants | Israel | 100.0 /100 | #15 | Exceptional $104,090 |
| Burmese | 100.0 /100 | #16 | Exceptional $103,145 |
| Immigrants | Korea | 100.0 /100 | #17 | Exceptional $102,962 |
| Cypriots | 100.0 /100 | #18 | Exceptional $102,843 |
| Immigrants | Australia | 100.0 /100 | #19 | Exceptional $102,562 |
| Bolivians | 100.0 /100 | #20 | Exceptional $102,195 |
| Eastern Europeans | 100.0 /100 | #21 | Exceptional $101,781 |
| Asians | 100.0 /100 | #22 | Exceptional $101,681 |
| Immigrants | Bolivia | 100.0 /100 | #23 | Exceptional $101,394 |
| Immigrants | Japan | 100.0 /100 | #24 | Exceptional $100,711 |
| Immigrants | Sweden | 100.0 /100 | #25 | Exceptional $100,699 |
| Immigrants | Belgium | 100.0 /100 | #26 | Exceptional $100,306 |