Colombian vs Celtic Median Household Income
COMPARE
Colombian
Celtic
Median Household Income
Median Household Income Comparison
Colombians
Celtics
$85,716
MEDIAN HOUSEHOLD INCOME
59.7/ 100
METRIC RATING
169th/ 347
METRIC RANK
$83,193
MEDIAN HOUSEHOLD INCOME
22.7/ 100
METRIC RATING
205th/ 347
METRIC RANK
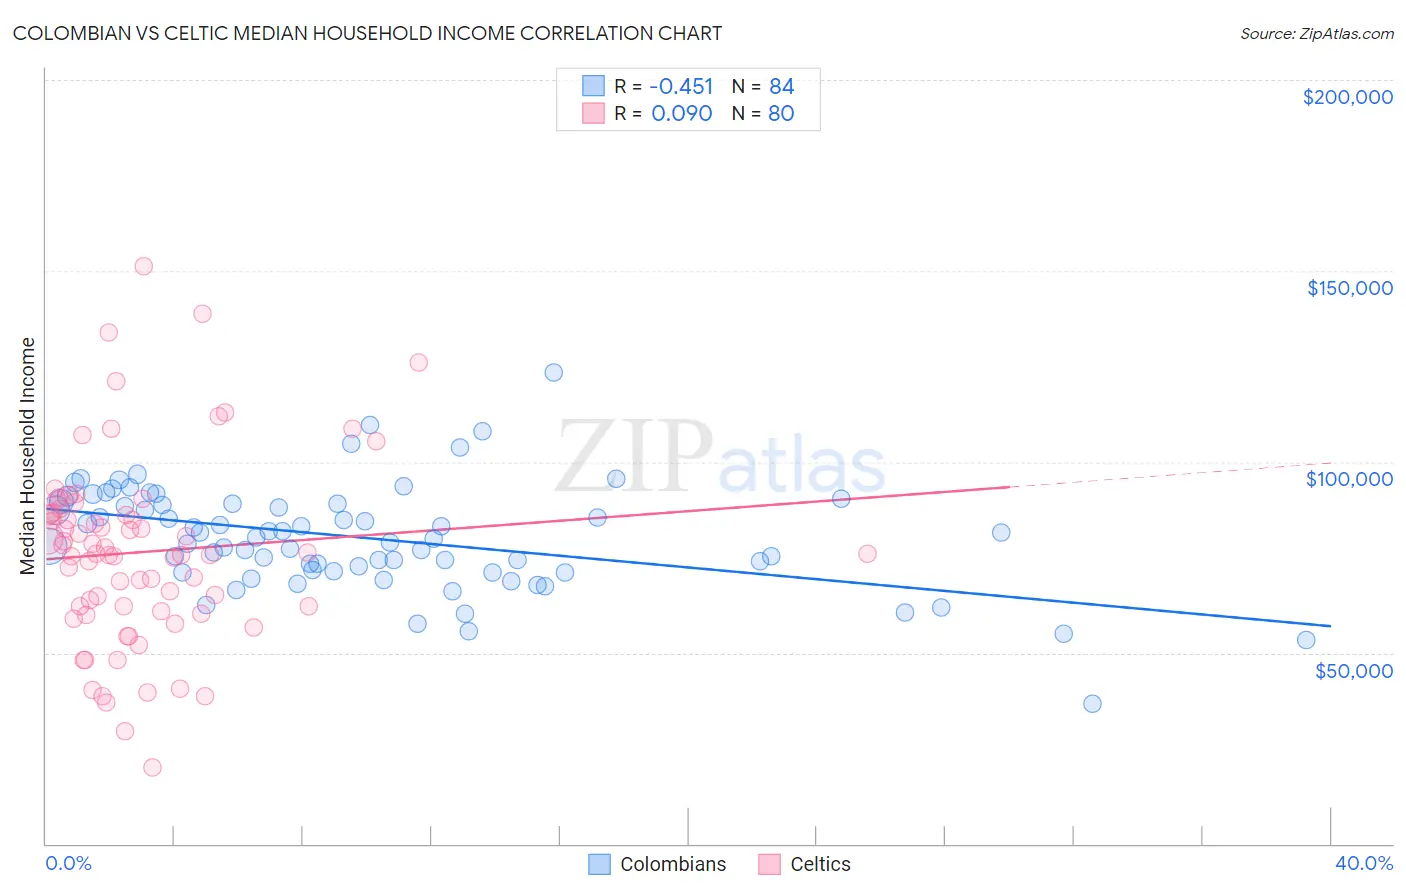
Colombian vs Celtic Median Household Income Correlation Chart
The statistical analysis conducted on geographies consisting of 419,147,971 people shows a moderate negative correlation between the proportion of Colombians and median household income in the United States with a correlation coefficient (R) of -0.451 and weighted average of $85,716. Similarly, the statistical analysis conducted on geographies consisting of 168,842,689 people shows a slight positive correlation between the proportion of Celtics and median household income in the United States with a correlation coefficient (R) of 0.090 and weighted average of $83,193, a difference of 3.0%.
Median Household Income Correlation Summary
| Measurement | Colombian | Celtic |
| Minimum | $36,563 | $19,921 |
| Maximum | $123,534 | $151,161 |
| Range | $86,971 | $131,240 |
| Mean | $80,109 | $76,393 |
| Median | $80,054 | $75,866 |
| Interquartile 25% (IQ1) | $71,412 | $61,507 |
| Interquartile 75% (IQ3) | $89,021 | $86,536 |
| Interquartile Range (IQR) | $17,609 | $25,028 |
| Standard Deviation (Sample) | $13,777 | $24,415 |
| Standard Deviation (Population) | $13,694 | $24,262 |
Similar Demographics by Median Household Income
Demographics Similar to Colombians by Median Household Income
In terms of median household income, the demographic groups most similar to Colombians are Swiss ($85,681, a difference of 0.040%), Icelander ($85,797, a difference of 0.090%), Immigrants ($85,818, a difference of 0.12%), Immigrants from South America ($85,611, a difference of 0.12%), and Slovene ($85,562, a difference of 0.18%).
| Demographics | Rating | Rank | Median Household Income |
| Guamanians/Chamorros | 67.7 /100 | #162 | Good $86,255 |
| Czechs | 66.4 /100 | #163 | Good $86,164 |
| Irish | 66.2 /100 | #164 | Good $86,145 |
| Norwegians | 65.3 /100 | #165 | Good $86,084 |
| Scandinavians | 65.1 /100 | #166 | Good $86,073 |
| Immigrants | Immigrants | 61.3 /100 | #167 | Good $85,818 |
| Icelanders | 61.0 /100 | #168 | Good $85,797 |
| Colombians | 59.7 /100 | #169 | Average $85,716 |
| Swiss | 59.2 /100 | #170 | Average $85,681 |
| Immigrants | South America | 58.1 /100 | #171 | Average $85,611 |
| Slovenes | 57.4 /100 | #172 | Average $85,562 |
| Immigrants | Cameroon | 53.4 /100 | #173 | Average $85,314 |
| Scottish | 50.0 /100 | #174 | Average $85,101 |
| Immigrants | Costa Rica | 49.2 /100 | #175 | Average $85,054 |
| Alsatians | 49.2 /100 | #176 | Average $85,053 |
Demographics Similar to Celtics by Median Household Income
In terms of median household income, the demographic groups most similar to Celtics are Immigrants from Africa ($83,289, a difference of 0.11%), Immigrants from Cambodia ($83,304, a difference of 0.13%), Immigrants from Kenya ($83,068, a difference of 0.15%), Immigrants from Thailand ($83,327, a difference of 0.16%), and Tsimshian ($83,346, a difference of 0.18%).
| Demographics | Rating | Rank | Median Household Income |
| Japanese | 25.1 /100 | #198 | Fair $83,395 |
| Germans | 24.6 /100 | #199 | Fair $83,358 |
| Tsimshian | 24.5 /100 | #200 | Fair $83,346 |
| Spanish | 24.4 /100 | #201 | Fair $83,343 |
| Immigrants | Thailand | 24.3 /100 | #202 | Fair $83,327 |
| Immigrants | Cambodia | 24.0 /100 | #203 | Fair $83,304 |
| Immigrants | Africa | 23.8 /100 | #204 | Fair $83,289 |
| Celtics | 22.7 /100 | #205 | Fair $83,193 |
| Immigrants | Kenya | 21.3 /100 | #206 | Fair $83,068 |
| Dutch | 20.3 /100 | #207 | Fair $82,971 |
| French Canadians | 18.7 /100 | #208 | Poor $82,810 |
| Immigrants | Iraq | 16.7 /100 | #209 | Poor $82,594 |
| Immigrants | Uruguay | 16.4 /100 | #210 | Poor $82,560 |
| Salvadorans | 15.4 /100 | #211 | Poor $82,449 |
| Venezuelans | 15.3 /100 | #212 | Poor $82,432 |