Colombian vs Immigrants from Dominica Median Household Income
COMPARE
Colombian
Immigrants from Dominica
Median Household Income
Median Household Income Comparison
Colombians
Immigrants from Dominica
$85,716
MEDIAN HOUSEHOLD INCOME
59.7/ 100
METRIC RATING
169th/ 347
METRIC RANK
$72,760
MEDIAN HOUSEHOLD INCOME
0.0/ 100
METRIC RATING
300th/ 347
METRIC RANK
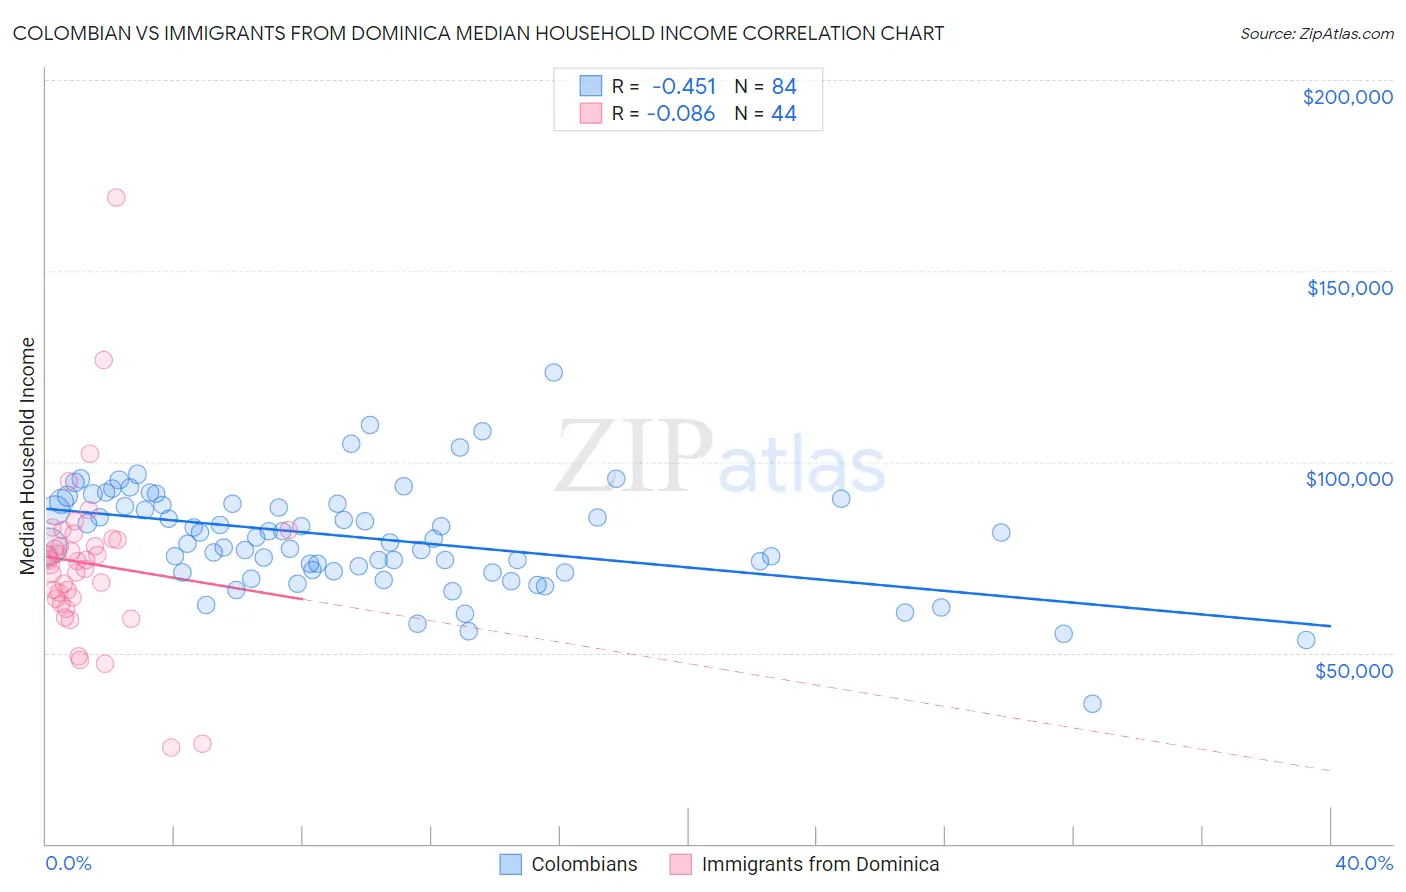
Colombian vs Immigrants from Dominica Median Household Income Correlation Chart
The statistical analysis conducted on geographies consisting of 419,147,971 people shows a moderate negative correlation between the proportion of Colombians and median household income in the United States with a correlation coefficient (R) of -0.451 and weighted average of $85,716. Similarly, the statistical analysis conducted on geographies consisting of 83,788,429 people shows a slight negative correlation between the proportion of Immigrants from Dominica and median household income in the United States with a correlation coefficient (R) of -0.086 and weighted average of $72,760, a difference of 17.8%.
Median Household Income Correlation Summary
| Measurement | Colombian | Immigrants from Dominica |
| Minimum | $36,563 | $25,050 |
| Maximum | $123,534 | $169,141 |
| Range | $86,971 | $144,091 |
| Mean | $80,109 | $73,512 |
| Median | $80,054 | $74,253 |
| Interquartile 25% (IQ1) | $71,412 | $64,327 |
| Interquartile 75% (IQ3) | $89,021 | $79,686 |
| Interquartile Range (IQR) | $17,609 | $15,359 |
| Standard Deviation (Sample) | $13,777 | $22,542 |
| Standard Deviation (Population) | $13,694 | $22,284 |
Similar Demographics by Median Household Income
Demographics Similar to Colombians by Median Household Income
In terms of median household income, the demographic groups most similar to Colombians are Swiss ($85,681, a difference of 0.040%), Icelander ($85,797, a difference of 0.090%), Immigrants ($85,818, a difference of 0.12%), Immigrants from South America ($85,611, a difference of 0.12%), and Slovene ($85,562, a difference of 0.18%).
| Demographics | Rating | Rank | Median Household Income |
| Guamanians/Chamorros | 67.7 /100 | #162 | Good $86,255 |
| Czechs | 66.4 /100 | #163 | Good $86,164 |
| Irish | 66.2 /100 | #164 | Good $86,145 |
| Norwegians | 65.3 /100 | #165 | Good $86,084 |
| Scandinavians | 65.1 /100 | #166 | Good $86,073 |
| Immigrants | Immigrants | 61.3 /100 | #167 | Good $85,818 |
| Icelanders | 61.0 /100 | #168 | Good $85,797 |
| Colombians | 59.7 /100 | #169 | Average $85,716 |
| Swiss | 59.2 /100 | #170 | Average $85,681 |
| Immigrants | South America | 58.1 /100 | #171 | Average $85,611 |
| Slovenes | 57.4 /100 | #172 | Average $85,562 |
| Immigrants | Cameroon | 53.4 /100 | #173 | Average $85,314 |
| Scottish | 50.0 /100 | #174 | Average $85,101 |
| Immigrants | Costa Rica | 49.2 /100 | #175 | Average $85,054 |
| Alsatians | 49.2 /100 | #176 | Average $85,053 |
Demographics Similar to Immigrants from Dominica by Median Household Income
In terms of median household income, the demographic groups most similar to Immigrants from Dominica are Cherokee ($72,682, a difference of 0.11%), Indonesian ($72,856, a difference of 0.13%), Shoshone ($72,660, a difference of 0.14%), African ($72,650, a difference of 0.15%), and Immigrants from Haiti ($72,599, a difference of 0.22%).
| Demographics | Rating | Rank | Median Household Income |
| Immigrants | Cabo Verde | 0.1 /100 | #293 | Tragic $73,515 |
| Blackfeet | 0.1 /100 | #294 | Tragic $73,509 |
| Cubans | 0.1 /100 | #295 | Tragic $73,392 |
| Haitians | 0.1 /100 | #296 | Tragic $73,306 |
| Immigrants | Mexico | 0.0 /100 | #297 | Tragic $73,160 |
| Paiute | 0.0 /100 | #298 | Tragic $72,959 |
| Indonesians | 0.0 /100 | #299 | Tragic $72,856 |
| Immigrants | Dominica | 0.0 /100 | #300 | Tragic $72,760 |
| Cherokee | 0.0 /100 | #301 | Tragic $72,682 |
| Shoshone | 0.0 /100 | #302 | Tragic $72,660 |
| Africans | 0.0 /100 | #303 | Tragic $72,650 |
| Immigrants | Haiti | 0.0 /100 | #304 | Tragic $72,599 |
| Hondurans | 0.0 /100 | #305 | Tragic $72,588 |
| Potawatomi | 0.0 /100 | #306 | Tragic $72,576 |
| Ute | 0.0 /100 | #307 | Tragic $72,402 |