Colombian vs Bhutanese Median Household Income

COMPARE

Colombian
Race
Ancestry
AfghanAfricanAlaska NativeAlaskan AthabascanAlbanianAleutAlsatianAmericanApacheArabArapahoArgentineanArmenianAssyrian/Chaldean/SyriacAustralianAustrianBahamianBangladeshiBarbadianBasqueBelgianBelizeanBermudanBlackfeetBolivianBrazilianBritishBritish West IndianBulgarianBurmeseCajunCambodianCanadianCape VerdeanCarpatho RusynCelticCentral AmericanCentral American IndianCherokeeCheyenneChickasawChileanChineseChippewaChoctawColombianColvilleComancheCosta RicanCreeCreekCroatianCrowCubanCypriotCzechCzechoslovakianDanishDelawareDominicanDutchDutch West IndianEastern EuropeanEcuadorianEgyptianEnglishEstonianEthiopianEuropeanFijianFilipinoFinnishFrenchFrench American IndianFrench CanadianGermanGerman RussianGhanaianGreekGuamanian/ChamorroGuatemalanGuyaneseHaitianHmongHonduranHopiHoumaHungarianIcelanderIndian (Asian)IndonesianInupiatIranianIraqiIrishIroquoisIsraeliItalianJamaicanJapaneseJordanianKenyanKiowaKoreanLaotianLatvianLebaneseLiberianLithuanianLumbeeLuxembourgerMacedonianMalaysianMalteseMarshalleseMenomineeMexicanMexican American IndianMongolianMoroccanNative HawaiianNavajoNepaleseNew ZealanderNicaraguanNigerianNorthern EuropeanNorwegianOkinawanOsageOttawaPaiutePakistaniPalestinianPanamanianParaguayanPennsylvania GermanPeruvianPimaPolishPortuguesePotawatomiPuebloPuerto RicanPuget Sound SalishRomanianRussianSalvadoranSamoanScandinavianScotch-IrishScottishSeminoleSenegaleseSerbianShoshoneSierra LeoneanSiouxSlavicSlovakSloveneSomaliSouth AfricanSouth AmericanSouth American IndianSoviet UnionSpaniardSpanishSpanish AmericanSpanish American IndianSri LankanSubsaharan AfricanSudaneseSwedishSwissSyrianTaiwaneseThaiTlingit-HaidaTohono O'OdhamTonganTrinidadian and TobagonianTsimshianTurkishU.S. Virgin IslanderUgandanUkrainianUruguayanUteVenezuelanVietnameseWelshWest IndianYakamaYaquiYugoslavianYumanYup'ikZimbabwean
Immigration
NonimmigrantsImmigrantsAfghanistanAfricaAlbaniaArgentinaArmeniaAsiaAustraliaAustriaBahamasBangladeshBarbadosBelarusBelgiumBelizeBoliviaBosnia and HerzegovinaBrazilBulgariaBurma/MyanmarCabo VerdeCambodiaCameroonCanadaCaribbeanCentral AmericaChileChinaColombiaCongoCosta RicaCroatiaCubaCzechoslovakiaDenmarkDominicaDominican RepublicEastern AfricaEastern AsiaEastern EuropeEcuadorEgyptEl SalvadorEnglandEritreaEthiopiaEuropeFijiFranceGermanyGhanaGreeceGrenadaGuatemalaGuyanaHaitiHondurasHong KongHungaryIndiaIndonesiaIranIraqIrelandIsraelItalyJamaicaJapanJordanKazakhstanKenyaKoreaKuwaitLaosLatin AmericaLatviaLebanonLiberiaLithuaniaMalaysiaMexicoMicronesiaMiddle AfricaMoldovaMoroccoNepalNetherlandsNicaraguaNigeriaNorth AmericaNorth MacedoniaNorthern AfricaNorthern EuropeNorwayOceaniaPakistanPanamaPeruPhilippinesPolandPortugalRomaniaRussiaSaudi ArabiaScotlandSenegalSerbiaSierra LeoneSingaporeSomaliaSouth AfricaSouth AmericaSouth Central AsiaSouth Eastern AsiaSouthern EuropeSpainSri LankaSt. Vincent and the GrenadinesSudanSwedenSwitzerlandSyriaTaiwanThailandTrinidad and TobagoTurkeyUgandaUkraineUruguayUzbekistanVenezuelaVietnamWest IndiesWestern AfricaWestern AsiaWestern EuropeYemenZaireZimbabweAzores
Bhutanese
Race
Ancestry
AfghanAfricanAlaska NativeAlaskan AthabascanAlbanianAleutAlsatianAmericanApacheArabArapahoArgentineanArmenianAssyrian/Chaldean/SyriacAustralianAustrianBahamianBangladeshiBarbadianBasqueBelgianBelizeanBermudanBhutaneseBlackfeetBolivianBrazilianBritishBritish West IndianBulgarianBurmeseCajunCambodianCanadianCape VerdeanCarpatho RusynCelticCentral AmericanCentral American IndianCherokeeCheyenneChickasawChileanChineseChippewaChoctawColvilleComancheCosta RicanCreeCreekCroatianCrowCubanCypriotCzechCzechoslovakianDanishDelawareDominicanDutchDutch West IndianEastern EuropeanEcuadorianEgyptianEnglishEstonianEthiopianEuropeanFijianFilipinoFinnishFrenchFrench American IndianFrench CanadianGermanGerman RussianGhanaianGreekGuamanian/ChamorroGuatemalanGuyaneseHaitianHmongHonduranHopiHoumaHungarianIcelanderIndian (Asian)IndonesianInupiatIranianIraqiIrishIroquoisIsraeliItalianJamaicanJapaneseJordanianKenyanKiowaKoreanLaotianLatvianLebaneseLiberianLithuanianLumbeeLuxembourgerMacedonianMalaysianMalteseMarshalleseMenomineeMexicanMexican American IndianMongolianMoroccanNative HawaiianNavajoNepaleseNew ZealanderNicaraguanNigerianNorthern EuropeanNorwegianOkinawanOsageOttawaPaiutePakistaniPalestinianPanamanianParaguayanPennsylvania GermanPeruvianPimaPolishPortuguesePotawatomiPuebloPuerto RicanPuget Sound SalishRomanianRussianSalvadoranSamoanScandinavianScotch-IrishScottishSeminoleSenegaleseSerbianShoshoneSierra LeoneanSiouxSlavicSlovakSloveneSomaliSouth AfricanSouth AmericanSouth American IndianSoviet UnionSpaniardSpanishSpanish AmericanSpanish American IndianSri LankanSubsaharan AfricanSudaneseSwedishSwissSyrianTaiwaneseThaiTlingit-HaidaTohono O'OdhamTonganTrinidadian and TobagonianTsimshianTurkishU.S. Virgin IslanderUgandanUkrainianUruguayanUteVenezuelanVietnameseWelshWest IndianYakamaYaquiYugoslavianYumanYup'ikZimbabwean
Immigration
NonimmigrantsImmigrantsAfghanistanAfricaAlbaniaArgentinaArmeniaAsiaAustraliaAustriaBahamasBangladeshBarbadosBelarusBelgiumBelizeBoliviaBosnia and HerzegovinaBrazilBulgariaBurma/MyanmarCabo VerdeCambodiaCameroonCanadaCaribbeanCentral AmericaChileChinaColombiaCongoCosta RicaCroatiaCubaCzechoslovakiaDenmarkDominicaDominican RepublicEastern AfricaEastern AsiaEastern EuropeEcuadorEgyptEl SalvadorEnglandEritreaEthiopiaEuropeFijiFranceGermanyGhanaGreeceGrenadaGuatemalaGuyanaHaitiHondurasHong KongHungaryIndiaIndonesiaIranIraqIrelandIsraelItalyJamaicaJapanJordanKazakhstanKenyaKoreaKuwaitLaosLatin AmericaLatviaLebanonLiberiaLithuaniaMalaysiaMexicoMicronesiaMiddle AfricaMoldovaMoroccoNepalNetherlandsNicaraguaNigeriaNorth AmericaNorth MacedoniaNorthern AfricaNorthern EuropeNorwayOceaniaPakistanPanamaPeruPhilippinesPolandPortugalRomaniaRussiaSaudi ArabiaScotlandSenegalSerbiaSierra LeoneSingaporeSomaliaSouth AfricaSouth AmericaSouth Central AsiaSouth Eastern AsiaSouthern EuropeSpainSri LankaSt. Vincent and the GrenadinesSudanSwedenSwitzerlandSyriaTaiwanThailandTrinidad and TobagoTurkeyUgandaUkraineUruguayUzbekistanVenezuelaVietnamWest IndiesWestern AfricaWestern AsiaWestern EuropeYemenZaireZimbabweAzores
Median Household Income
Income
Poverty
Unemployment
Labor Participation
Family Structure
Vehicle Availability
Education Level
Disability

Median Household Income Comparison

Colombians

Bhutanese

Average
Exceptional
$85,716
MEDIAN HOUSEHOLD INCOME
59.7/ 100
METRIC RATING
169th/ 347
METRIC RANK
$100,151
MEDIAN HOUSEHOLD INCOME
100.0/ 100
METRIC RATING
27th/ 347
METRIC RANK

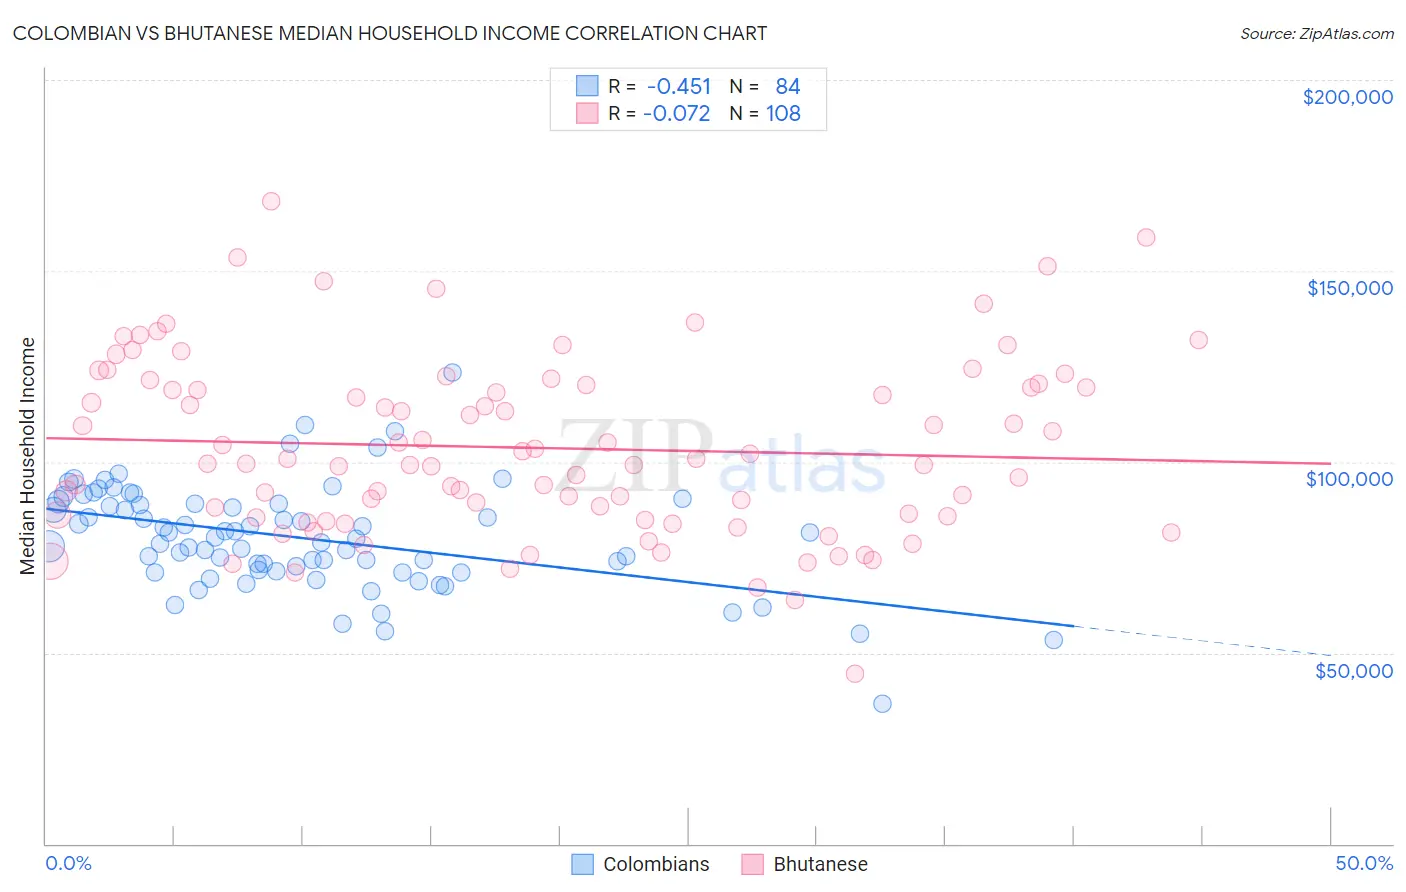
Colombian vs Bhutanese Median Household Income Correlation Chart

The statistical analysis conducted on geographies consisting of 419,147,971 people shows a moderate negative correlation between the proportion of Colombians and median household income in the United States with a correlation coefficient (R) of -0.451 and weighted average of $85,716. Similarly, the statistical analysis conducted on geographies consisting of 455,036,820 people shows a slight negative correlation between the proportion of Bhutanese and median household income in the United States with a correlation coefficient (R) of -0.072 and weighted average of $100,151, a difference of 16.8%.
Colombian vs Bhutanese Median Household Income

Median Household Income Correlation Summary

MeasurementColombianBhutanese
Minimum$36,563$44,611
Maximum$123,534$168,247
Range$86,971$123,636
Mean$80,109$103,677
Median$80,054$100,131
Interquartile 25% (IQ1)$71,412$85,552
Interquartile 75% (IQ3)$89,021$119,777
Interquartile Range (IQR)$17,609$34,225
Standard Deviation (Sample)$13,777$23,044
Standard Deviation (Population)$13,694$22,937

Similar Demographics by Median Household Income

Demographics Similar to Colombians by Median Household Income

In terms of median household income, the demographic groups most similar to Colombians are Swiss ($85,681, a difference of 0.040%), Icelander ($85,797, a difference of 0.090%), Immigrants ($85,818, a difference of 0.12%), Immigrants from South America ($85,611, a difference of 0.12%), and Slovene ($85,562, a difference of 0.18%).
DemographicsRating | RankMedian Household Income
Guamanians/Chamorros
67.7
/100
|
#162
Good
$86,255
Czechs
66.4
/100
|
#163
Good
$86,164
Irish
66.2
/100
|
#164
Good
$86,145
Norwegians
65.3
/100
|
#165
Good
$86,084
Scandinavians
65.1
/100
|
#166
Good
$86,073
Immigrants | Immigrants
61.3
/100
|
#167
Good
$85,818
Icelanders
61.0
/100
|
#168
Good
$85,797
Colombians
59.7
/100
|
#169
Average
$85,716
Swiss
59.2
/100
|
#170
Average
$85,681
Immigrants | South America
58.1
/100
|
#171
Average
$85,611
Slovenes
57.4
/100
|
#172
Average
$85,562
Immigrants | Cameroon
53.4
/100
|
#173
Average
$85,314
Scottish
50.0
/100
|
#174
Average
$85,101
Immigrants | Costa Rica
49.2
/100
|
#175
Average
$85,054
Alsatians
49.2
/100
|
#176
Average
$85,053

Demographics Similar to Bhutanese by Median Household Income

In terms of median household income, the demographic groups most similar to Bhutanese are Immigrants from Belgium ($100,306, a difference of 0.15%), Immigrants from Sri Lanka ($99,943, a difference of 0.21%), Immigrants from Asia ($99,933, a difference of 0.22%), Immigrants from Northern Europe ($99,813, a difference of 0.34%), and Immigrants from Sweden ($100,699, a difference of 0.55%).
DemographicsRating | RankMedian Household Income
Bolivians
100.0
/100
|
#20
Exceptional
$102,195
Eastern Europeans
100.0
/100
|
#21
Exceptional
$101,781
Asians
100.0
/100
|
#22
Exceptional
$101,681
Immigrants | Bolivia
100.0
/100
|
#23
Exceptional
$101,394
Immigrants | Japan
100.0
/100
|
#24
Exceptional
$100,711
Immigrants | Sweden
100.0
/100
|
#25
Exceptional
$100,699
Immigrants | Belgium
100.0
/100
|
#26
Exceptional
$100,306
Bhutanese
100.0
/100
|
#27
Exceptional
$100,151
Immigrants | Sri Lanka
100.0
/100
|
#28
Exceptional
$99,943
Immigrants | Asia
100.0
/100
|
#29
Exceptional
$99,933
Immigrants | Northern Europe
100.0
/100
|
#30
Exceptional
$99,813
Turks
100.0
/100
|
#31
Exceptional
$99,389
Immigrants | Denmark
100.0
/100
|
#32
Exceptional
$98,510
Chinese
100.0
/100
|
#33
Exceptional
$98,496
Russians
100.0
/100
|
#34
Exceptional
$98,008