Immigrants from Eastern Europe vs Central American Indian Median Household Income
COMPARE
Immigrants from Eastern Europe
Central American Indian
Median Household Income
Median Household Income Comparison
Immigrants from Eastern Europe
Central American Indians
$93,051
MEDIAN HOUSEHOLD INCOME
99.4/ 100
METRIC RATING
81st/ 347
METRIC RANK
$74,847
MEDIAN HOUSEHOLD INCOME
0.1/ 100
METRIC RATING
282nd/ 347
METRIC RANK
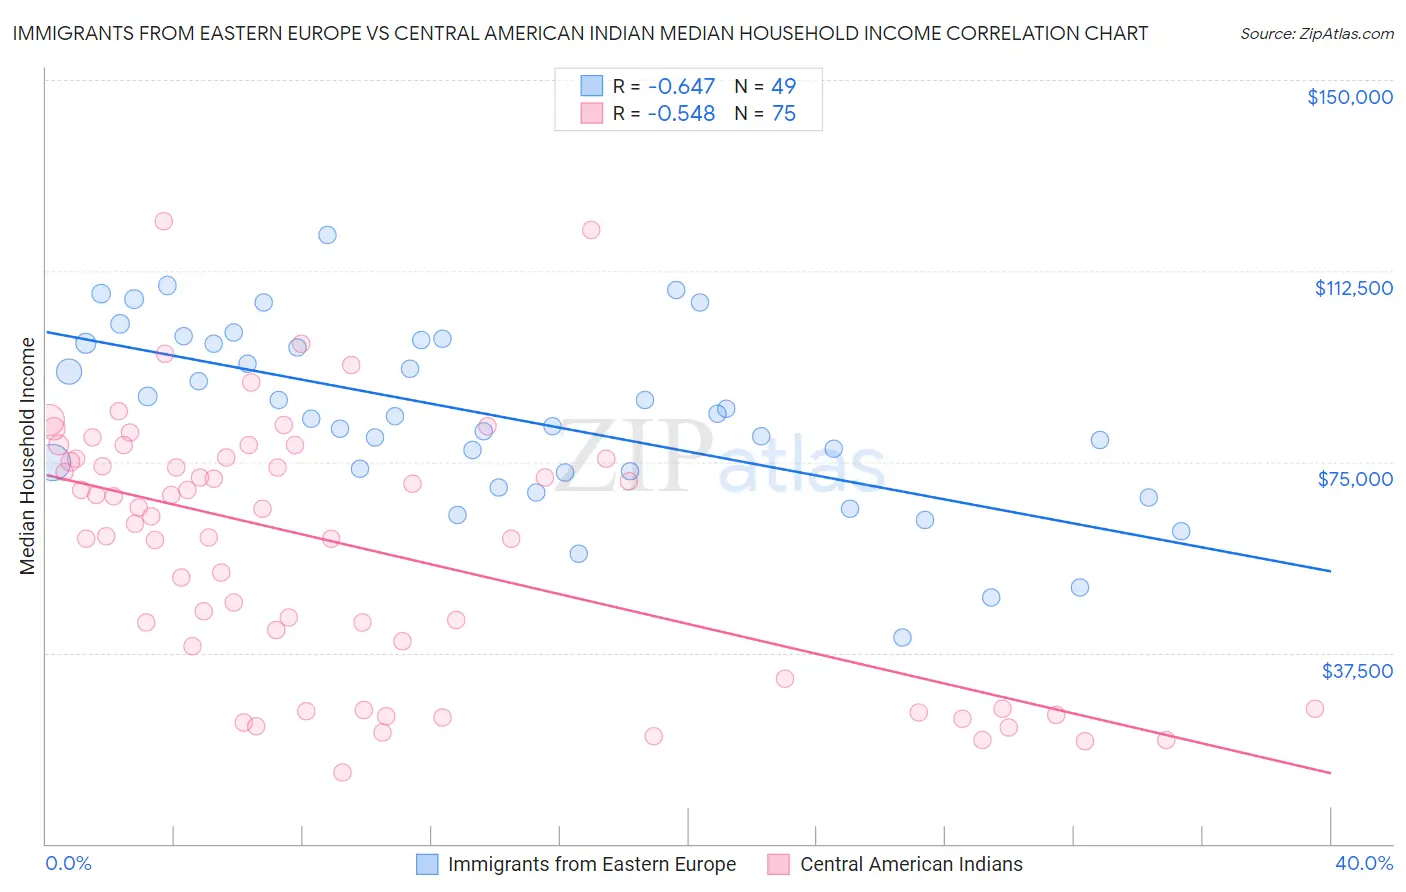
Immigrants from Eastern Europe vs Central American Indian Median Household Income Correlation Chart
The statistical analysis conducted on geographies consisting of 475,370,046 people shows a significant negative correlation between the proportion of Immigrants from Eastern Europe and median household income in the United States with a correlation coefficient (R) of -0.647 and weighted average of $93,051. Similarly, the statistical analysis conducted on geographies consisting of 326,011,842 people shows a substantial negative correlation between the proportion of Central American Indians and median household income in the United States with a correlation coefficient (R) of -0.548 and weighted average of $74,847, a difference of 24.3%.
Median Household Income Correlation Summary
| Measurement | Immigrants from Eastern Europe | Central American Indian |
| Minimum | $40,467 | $14,073 |
| Maximum | $119,517 | $122,237 |
| Range | $79,050 | $108,164 |
| Mean | $84,121 | $58,298 |
| Median | $83,863 | $64,310 |
| Interquartile 25% (IQ1) | $72,994 | $32,456 |
| Interquartile 75% (IQ3) | $98,652 | $75,688 |
| Interquartile Range (IQR) | $25,658 | $43,232 |
| Standard Deviation (Sample) | $17,573 | $25,417 |
| Standard Deviation (Population) | $17,393 | $25,247 |
Similar Demographics by Median Household Income
Demographics Similar to Immigrants from Eastern Europe by Median Household Income
In terms of median household income, the demographic groups most similar to Immigrants from Eastern Europe are Tongan ($93,076, a difference of 0.030%), Sri Lankan ($93,093, a difference of 0.050%), Immigrants from Bulgaria ($93,148, a difference of 0.10%), Immigrants from Spain ($92,732, a difference of 0.34%), and South African ($93,379, a difference of 0.35%).
| Demographics | Rating | Rank | Median Household Income |
| Immigrants | Latvia | 99.6 /100 | #74 | Exceptional $93,602 |
| Immigrants | Italy | 99.5 /100 | #75 | Exceptional $93,465 |
| South Africans | 99.5 /100 | #76 | Exceptional $93,379 |
| Immigrants | Afghanistan | 99.5 /100 | #77 | Exceptional $93,375 |
| Immigrants | Bulgaria | 99.4 /100 | #78 | Exceptional $93,148 |
| Sri Lankans | 99.4 /100 | #79 | Exceptional $93,093 |
| Tongans | 99.4 /100 | #80 | Exceptional $93,076 |
| Immigrants | Eastern Europe | 99.4 /100 | #81 | Exceptional $93,051 |
| Immigrants | Spain | 99.3 /100 | #82 | Exceptional $92,732 |
| Italians | 99.1 /100 | #83 | Exceptional $92,475 |
| Immigrants | Argentina | 99.1 /100 | #84 | Exceptional $92,417 |
| Immigrants | Croatia | 99.0 /100 | #85 | Exceptional $92,225 |
| Immigrants | England | 98.9 /100 | #86 | Exceptional $92,098 |
| Immigrants | Hungary | 98.9 /100 | #87 | Exceptional $92,094 |
| Immigrants | Canada | 98.8 /100 | #88 | Exceptional $92,029 |
Demographics Similar to Central American Indians by Median Household Income
In terms of median household income, the demographic groups most similar to Central American Indians are Immigrants from Liberia ($74,896, a difference of 0.070%), Senegalese ($74,999, a difference of 0.20%), Cree ($74,685, a difference of 0.22%), Yaqui ($74,596, a difference of 0.34%), and Immigrants from Guatemala ($75,123, a difference of 0.37%).
| Demographics | Rating | Rank | Median Household Income |
| Immigrants | Micronesia | 0.2 /100 | #275 | Tragic $75,574 |
| Immigrants | Latin America | 0.2 /100 | #276 | Tragic $75,420 |
| Spanish Americans | 0.2 /100 | #277 | Tragic $75,386 |
| Osage | 0.2 /100 | #278 | Tragic $75,240 |
| Immigrants | Guatemala | 0.2 /100 | #279 | Tragic $75,123 |
| Senegalese | 0.2 /100 | #280 | Tragic $74,999 |
| Immigrants | Liberia | 0.1 /100 | #281 | Tragic $74,896 |
| Central American Indians | 0.1 /100 | #282 | Tragic $74,847 |
| Cree | 0.1 /100 | #283 | Tragic $74,685 |
| Yaqui | 0.1 /100 | #284 | Tragic $74,596 |
| Mexicans | 0.1 /100 | #285 | Tragic $74,399 |
| Immigrants | Somalia | 0.1 /100 | #286 | Tragic $74,300 |
| Iroquois | 0.1 /100 | #287 | Tragic $74,279 |
| Immigrants | Central America | 0.1 /100 | #288 | Tragic $74,217 |
| Fijians | 0.1 /100 | #289 | Tragic $74,205 |