Immigrants from Ghana vs Bhutanese Median Household Income
COMPARE
Immigrants from Ghana
Bhutanese
Median Household Income
Median Household Income Comparison
Immigrants from Ghana
Bhutanese
$81,489
MEDIAN HOUSEHOLD INCOME
9.0/ 100
METRIC RATING
221st/ 347
METRIC RANK
$100,151
MEDIAN HOUSEHOLD INCOME
100.0/ 100
METRIC RATING
27th/ 347
METRIC RANK
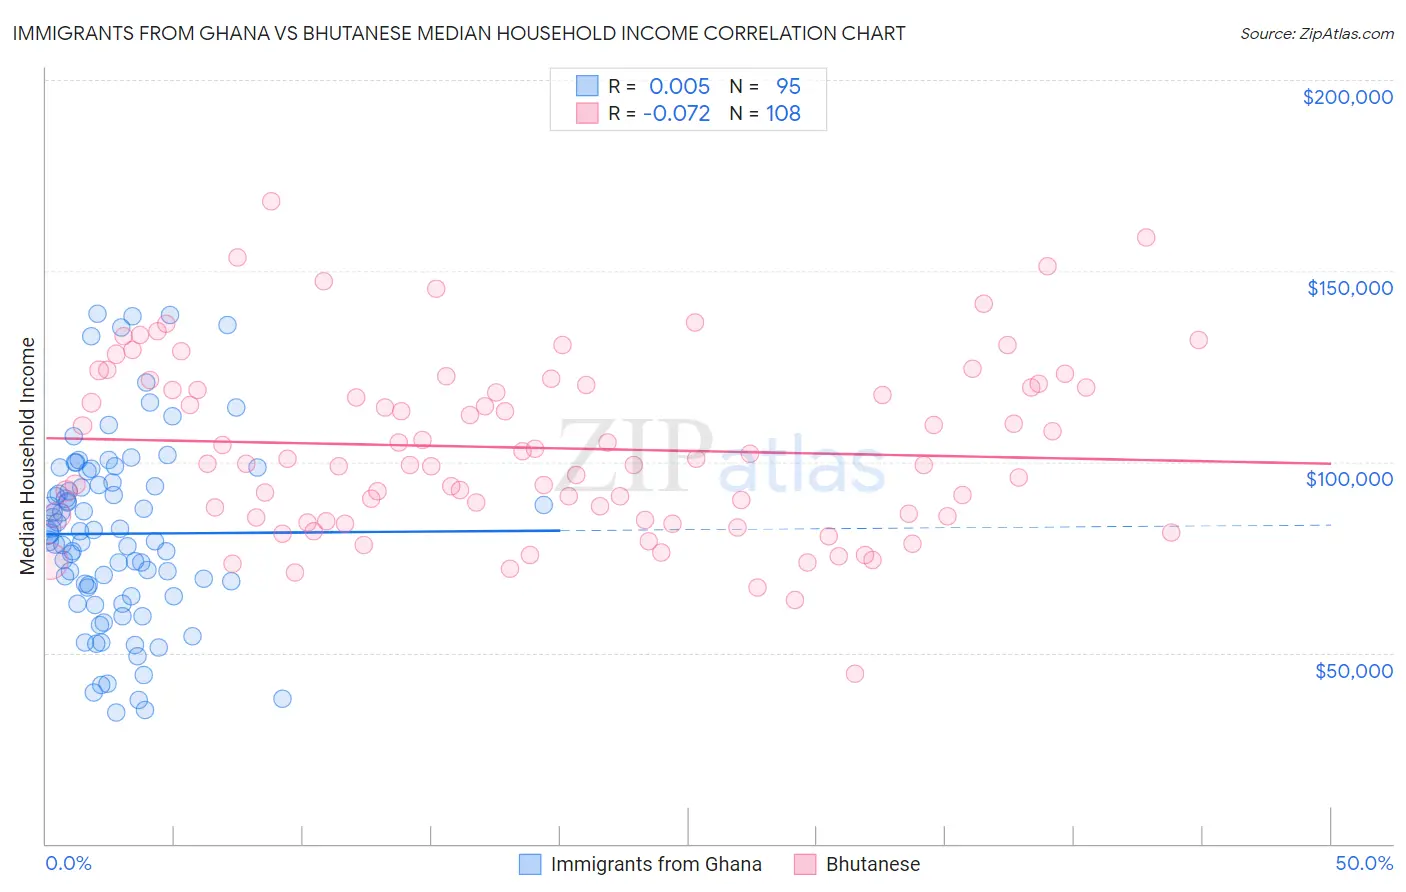
Immigrants from Ghana vs Bhutanese Median Household Income Correlation Chart
The statistical analysis conducted on geographies consisting of 199,784,563 people shows no correlation between the proportion of Immigrants from Ghana and median household income in the United States with a correlation coefficient (R) of 0.005 and weighted average of $81,489. Similarly, the statistical analysis conducted on geographies consisting of 455,036,820 people shows a slight negative correlation between the proportion of Bhutanese and median household income in the United States with a correlation coefficient (R) of -0.072 and weighted average of $100,151, a difference of 22.9%.
Median Household Income Correlation Summary
| Measurement | Immigrants from Ghana | Bhutanese |
| Minimum | $34,375 | $44,611 |
| Maximum | $138,703 | $168,247 |
| Range | $104,328 | $123,636 |
| Mean | $81,173 | $103,677 |
| Median | $81,072 | $100,131 |
| Interquartile 25% (IQ1) | $64,873 | $85,552 |
| Interquartile 75% (IQ3) | $94,696 | $119,777 |
| Interquartile Range (IQR) | $29,822 | $34,225 |
| Standard Deviation (Sample) | $24,293 | $23,044 |
| Standard Deviation (Population) | $24,164 | $22,937 |
Similar Demographics by Median Household Income
Demographics Similar to Immigrants from Ghana by Median Household Income
In terms of median household income, the demographic groups most similar to Immigrants from Ghana are Immigrants from Venezuela ($81,506, a difference of 0.020%), Nigerian ($81,725, a difference of 0.29%), Immigrants from Nigeria ($81,236, a difference of 0.31%), Immigrants from El Salvador ($81,213, a difference of 0.34%), and Malaysian ($81,064, a difference of 0.52%).
| Demographics | Rating | Rank | Median Household Income |
| Panamanians | 14.0 /100 | #214 | Poor $82,272 |
| Vietnamese | 13.8 /100 | #215 | Poor $82,248 |
| Yugoslavians | 13.3 /100 | #216 | Poor $82,186 |
| Ecuadorians | 12.5 /100 | #217 | Poor $82,070 |
| Whites/Caucasians | 12.2 /100 | #218 | Poor $82,029 |
| Nigerians | 10.3 /100 | #219 | Poor $81,725 |
| Immigrants | Venezuela | 9.0 /100 | #220 | Tragic $81,506 |
| Immigrants | Ghana | 9.0 /100 | #221 | Tragic $81,489 |
| Immigrants | Nigeria | 7.7 /100 | #222 | Tragic $81,236 |
| Immigrants | El Salvador | 7.6 /100 | #223 | Tragic $81,213 |
| Malaysians | 7.0 /100 | #224 | Tragic $81,064 |
| Scotch-Irish | 6.6 /100 | #225 | Tragic $80,972 |
| Immigrants | Panama | 6.2 /100 | #226 | Tragic $80,873 |
| Guyanese | 5.7 /100 | #227 | Tragic $80,734 |
| Immigrants | Bangladesh | 5.7 /100 | #228 | Tragic $80,722 |
Demographics Similar to Bhutanese by Median Household Income
In terms of median household income, the demographic groups most similar to Bhutanese are Immigrants from Belgium ($100,306, a difference of 0.15%), Immigrants from Sri Lanka ($99,943, a difference of 0.21%), Immigrants from Asia ($99,933, a difference of 0.22%), Immigrants from Northern Europe ($99,813, a difference of 0.34%), and Immigrants from Sweden ($100,699, a difference of 0.55%).
| Demographics | Rating | Rank | Median Household Income |
| Bolivians | 100.0 /100 | #20 | Exceptional $102,195 |
| Eastern Europeans | 100.0 /100 | #21 | Exceptional $101,781 |
| Asians | 100.0 /100 | #22 | Exceptional $101,681 |
| Immigrants | Bolivia | 100.0 /100 | #23 | Exceptional $101,394 |
| Immigrants | Japan | 100.0 /100 | #24 | Exceptional $100,711 |
| Immigrants | Sweden | 100.0 /100 | #25 | Exceptional $100,699 |
| Immigrants | Belgium | 100.0 /100 | #26 | Exceptional $100,306 |
| Bhutanese | 100.0 /100 | #27 | Exceptional $100,151 |
| Immigrants | Sri Lanka | 100.0 /100 | #28 | Exceptional $99,943 |
| Immigrants | Asia | 100.0 /100 | #29 | Exceptional $99,933 |
| Immigrants | Northern Europe | 100.0 /100 | #30 | Exceptional $99,813 |
| Turks | 100.0 /100 | #31 | Exceptional $99,389 |
| Immigrants | Denmark | 100.0 /100 | #32 | Exceptional $98,510 |
| Chinese | 100.0 /100 | #33 | Exceptional $98,496 |
| Russians | 100.0 /100 | #34 | Exceptional $98,008 |