Russian vs Bhutanese Median Household Income
COMPARE
Russian
Bhutanese
Median Household Income
Median Household Income Comparison
Russians
Bhutanese
$98,008
MEDIAN HOUSEHOLD INCOME
100.0/ 100
METRIC RATING
34th/ 347
METRIC RANK
$100,151
MEDIAN HOUSEHOLD INCOME
100.0/ 100
METRIC RATING
27th/ 347
METRIC RANK
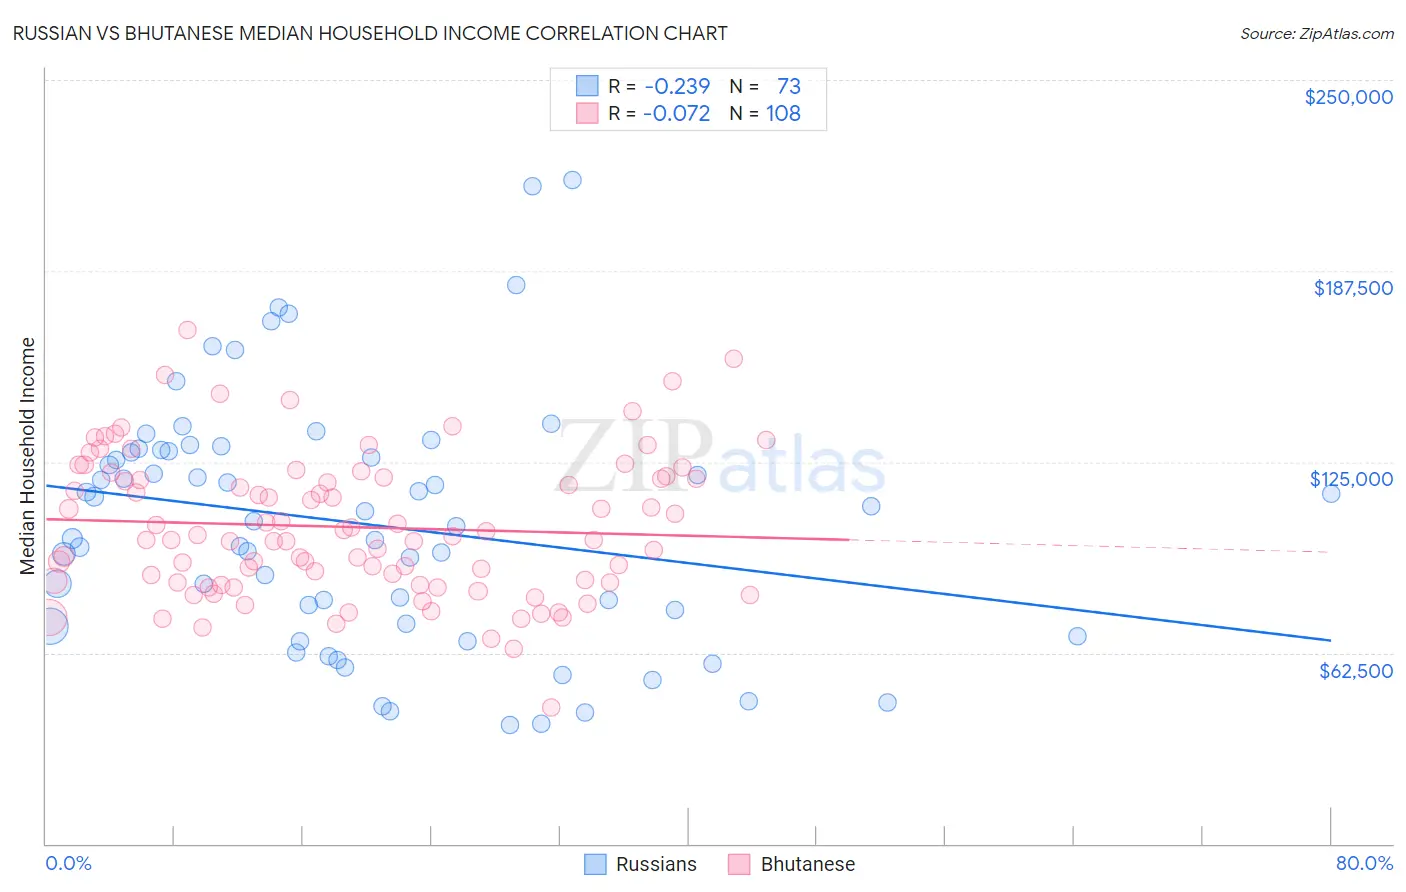
Russian vs Bhutanese Median Household Income Correlation Chart
The statistical analysis conducted on geographies consisting of 511,515,990 people shows a weak negative correlation between the proportion of Russians and median household income in the United States with a correlation coefficient (R) of -0.239 and weighted average of $98,008. Similarly, the statistical analysis conducted on geographies consisting of 455,036,820 people shows a slight negative correlation between the proportion of Bhutanese and median household income in the United States with a correlation coefficient (R) of -0.072 and weighted average of $100,151, a difference of 2.2%.
Median Household Income Correlation Summary
| Measurement | Russian | Bhutanese |
| Minimum | $38,750 | $44,611 |
| Maximum | $217,375 | $168,247 |
| Range | $178,625 | $123,636 |
| Mean | $104,714 | $103,677 |
| Median | $105,523 | $100,131 |
| Interquartile 25% (IQ1) | $71,539 | $85,552 |
| Interquartile 75% (IQ3) | $128,679 | $119,777 |
| Interquartile Range (IQR) | $57,140 | $34,225 |
| Standard Deviation (Sample) | $40,584 | $23,044 |
| Standard Deviation (Population) | $40,305 | $22,937 |
Demographics Similar to Russians and Bhutanese by Median Household Income
In terms of median household income, the demographic groups most similar to Russians are Immigrants from Switzerland ($97,979, a difference of 0.030%), Immigrants from Pakistan ($97,528, a difference of 0.49%), Chinese ($98,496, a difference of 0.50%), Immigrants from Denmark ($98,510, a difference of 0.51%), and Latvian ($97,311, a difference of 0.72%). Similarly, the demographic groups most similar to Bhutanese are Immigrants from Belgium ($100,306, a difference of 0.15%), Immigrants from Sri Lanka ($99,943, a difference of 0.21%), Immigrants from Asia ($99,933, a difference of 0.22%), Immigrants from Northern Europe ($99,813, a difference of 0.34%), and Immigrants from Sweden ($100,699, a difference of 0.55%).
| Demographics | Rating | Rank | Median Household Income |
| Bolivians | 100.0 /100 | #20 | Exceptional $102,195 |
| Eastern Europeans | 100.0 /100 | #21 | Exceptional $101,781 |
| Asians | 100.0 /100 | #22 | Exceptional $101,681 |
| Immigrants | Bolivia | 100.0 /100 | #23 | Exceptional $101,394 |
| Immigrants | Japan | 100.0 /100 | #24 | Exceptional $100,711 |
| Immigrants | Sweden | 100.0 /100 | #25 | Exceptional $100,699 |
| Immigrants | Belgium | 100.0 /100 | #26 | Exceptional $100,306 |
| Bhutanese | 100.0 /100 | #27 | Exceptional $100,151 |
| Immigrants | Sri Lanka | 100.0 /100 | #28 | Exceptional $99,943 |
| Immigrants | Asia | 100.0 /100 | #29 | Exceptional $99,933 |
| Immigrants | Northern Europe | 100.0 /100 | #30 | Exceptional $99,813 |
| Turks | 100.0 /100 | #31 | Exceptional $99,389 |
| Immigrants | Denmark | 100.0 /100 | #32 | Exceptional $98,510 |
| Chinese | 100.0 /100 | #33 | Exceptional $98,496 |
| Russians | 100.0 /100 | #34 | Exceptional $98,008 |
| Immigrants | Switzerland | 100.0 /100 | #35 | Exceptional $97,979 |
| Immigrants | Pakistan | 100.0 /100 | #36 | Exceptional $97,528 |
| Latvians | 100.0 /100 | #37 | Exceptional $97,311 |
| Immigrants | Indonesia | 100.0 /100 | #38 | Exceptional $97,297 |
| Afghans | 100.0 /100 | #39 | Exceptional $97,026 |
| Maltese | 100.0 /100 | #40 | Exceptional $97,015 |