Tsimshian vs Bhutanese Median Household Income
COMPARE
Tsimshian
Bhutanese
Median Household Income
Median Household Income Comparison
Tsimshian
Bhutanese
$83,346
MEDIAN HOUSEHOLD INCOME
24.5/ 100
METRIC RATING
200th/ 347
METRIC RANK
$100,151
MEDIAN HOUSEHOLD INCOME
100.0/ 100
METRIC RATING
27th/ 347
METRIC RANK
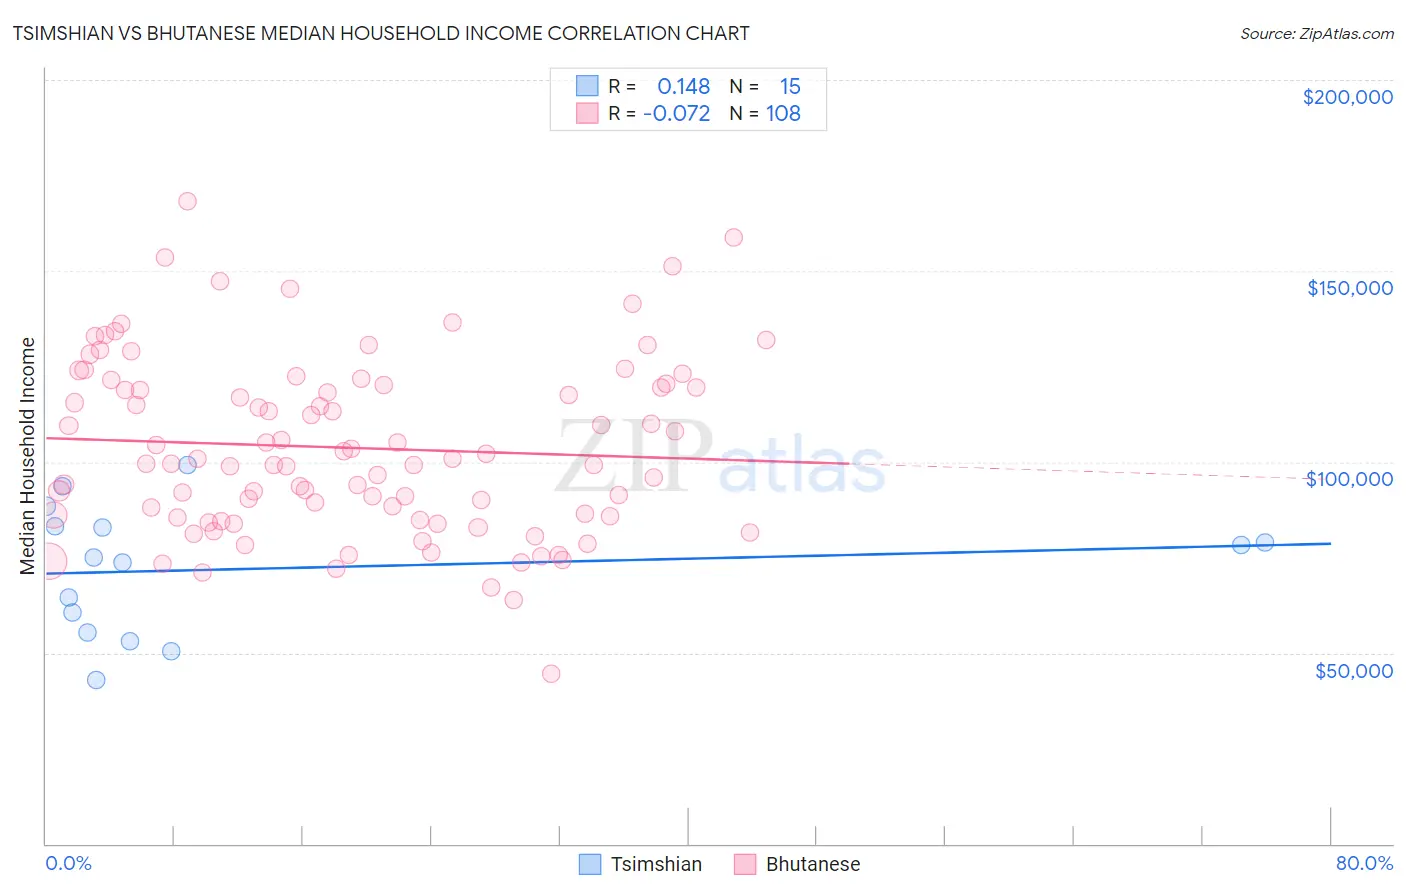
Tsimshian vs Bhutanese Median Household Income Correlation Chart
The statistical analysis conducted on geographies consisting of 15,626,462 people shows a poor positive correlation between the proportion of Tsimshian and median household income in the United States with a correlation coefficient (R) of 0.148 and weighted average of $83,346. Similarly, the statistical analysis conducted on geographies consisting of 455,036,820 people shows a slight negative correlation between the proportion of Bhutanese and median household income in the United States with a correlation coefficient (R) of -0.072 and weighted average of $100,151, a difference of 20.2%.
Median Household Income Correlation Summary
| Measurement | Tsimshian | Bhutanese |
| Minimum | $42,857 | $44,611 |
| Maximum | $99,167 | $168,247 |
| Range | $56,310 | $123,636 |
| Mean | $71,994 | $103,677 |
| Median | $75,000 | $100,131 |
| Interquartile 25% (IQ1) | $55,448 | $85,552 |
| Interquartile 75% (IQ3) | $83,217 | $119,777 |
| Interquartile Range (IQR) | $27,769 | $34,225 |
| Standard Deviation (Sample) | $16,777 | $23,044 |
| Standard Deviation (Population) | $16,208 | $22,937 |
Similar Demographics by Median Household Income
Demographics Similar to Tsimshian by Median Household Income
In terms of median household income, the demographic groups most similar to Tsimshian are Spanish ($83,343, a difference of 0.0%), German ($83,358, a difference of 0.010%), Immigrants from Thailand ($83,327, a difference of 0.020%), Immigrants from Cambodia ($83,304, a difference of 0.050%), and Japanese ($83,395, a difference of 0.060%).
| Demographics | Rating | Rank | Median Household Income |
| Finns | 27.7 /100 | #193 | Fair $83,607 |
| Ghanaians | 27.4 /100 | #194 | Fair $83,582 |
| Immigrants | Armenia | 27.0 /100 | #195 | Fair $83,555 |
| French | 26.0 /100 | #196 | Fair $83,468 |
| Aleuts | 25.7 /100 | #197 | Fair $83,446 |
| Japanese | 25.1 /100 | #198 | Fair $83,395 |
| Germans | 24.6 /100 | #199 | Fair $83,358 |
| Tsimshian | 24.5 /100 | #200 | Fair $83,346 |
| Spanish | 24.4 /100 | #201 | Fair $83,343 |
| Immigrants | Thailand | 24.3 /100 | #202 | Fair $83,327 |
| Immigrants | Cambodia | 24.0 /100 | #203 | Fair $83,304 |
| Immigrants | Africa | 23.8 /100 | #204 | Fair $83,289 |
| Celtics | 22.7 /100 | #205 | Fair $83,193 |
| Immigrants | Kenya | 21.3 /100 | #206 | Fair $83,068 |
| Dutch | 20.3 /100 | #207 | Fair $82,971 |
Demographics Similar to Bhutanese by Median Household Income
In terms of median household income, the demographic groups most similar to Bhutanese are Immigrants from Belgium ($100,306, a difference of 0.15%), Immigrants from Sri Lanka ($99,943, a difference of 0.21%), Immigrants from Asia ($99,933, a difference of 0.22%), Immigrants from Northern Europe ($99,813, a difference of 0.34%), and Immigrants from Sweden ($100,699, a difference of 0.55%).
| Demographics | Rating | Rank | Median Household Income |
| Bolivians | 100.0 /100 | #20 | Exceptional $102,195 |
| Eastern Europeans | 100.0 /100 | #21 | Exceptional $101,781 |
| Asians | 100.0 /100 | #22 | Exceptional $101,681 |
| Immigrants | Bolivia | 100.0 /100 | #23 | Exceptional $101,394 |
| Immigrants | Japan | 100.0 /100 | #24 | Exceptional $100,711 |
| Immigrants | Sweden | 100.0 /100 | #25 | Exceptional $100,699 |
| Immigrants | Belgium | 100.0 /100 | #26 | Exceptional $100,306 |
| Bhutanese | 100.0 /100 | #27 | Exceptional $100,151 |
| Immigrants | Sri Lanka | 100.0 /100 | #28 | Exceptional $99,943 |
| Immigrants | Asia | 100.0 /100 | #29 | Exceptional $99,933 |
| Immigrants | Northern Europe | 100.0 /100 | #30 | Exceptional $99,813 |
| Turks | 100.0 /100 | #31 | Exceptional $99,389 |
| Immigrants | Denmark | 100.0 /100 | #32 | Exceptional $98,510 |
| Chinese | 100.0 /100 | #33 | Exceptional $98,496 |
| Russians | 100.0 /100 | #34 | Exceptional $98,008 |