Choctaw vs Salvadoran Median Family Income
COMPARE
Choctaw
Salvadoran
Median Family Income
Median Family Income Comparison
Choctaw
Salvadorans
$84,835
MEDIAN FAMILY INCOME
0.0/ 100
METRIC RATING
313th/ 347
METRIC RANK
$94,109
MEDIAN FAMILY INCOME
1.2/ 100
METRIC RATING
239th/ 347
METRIC RANK
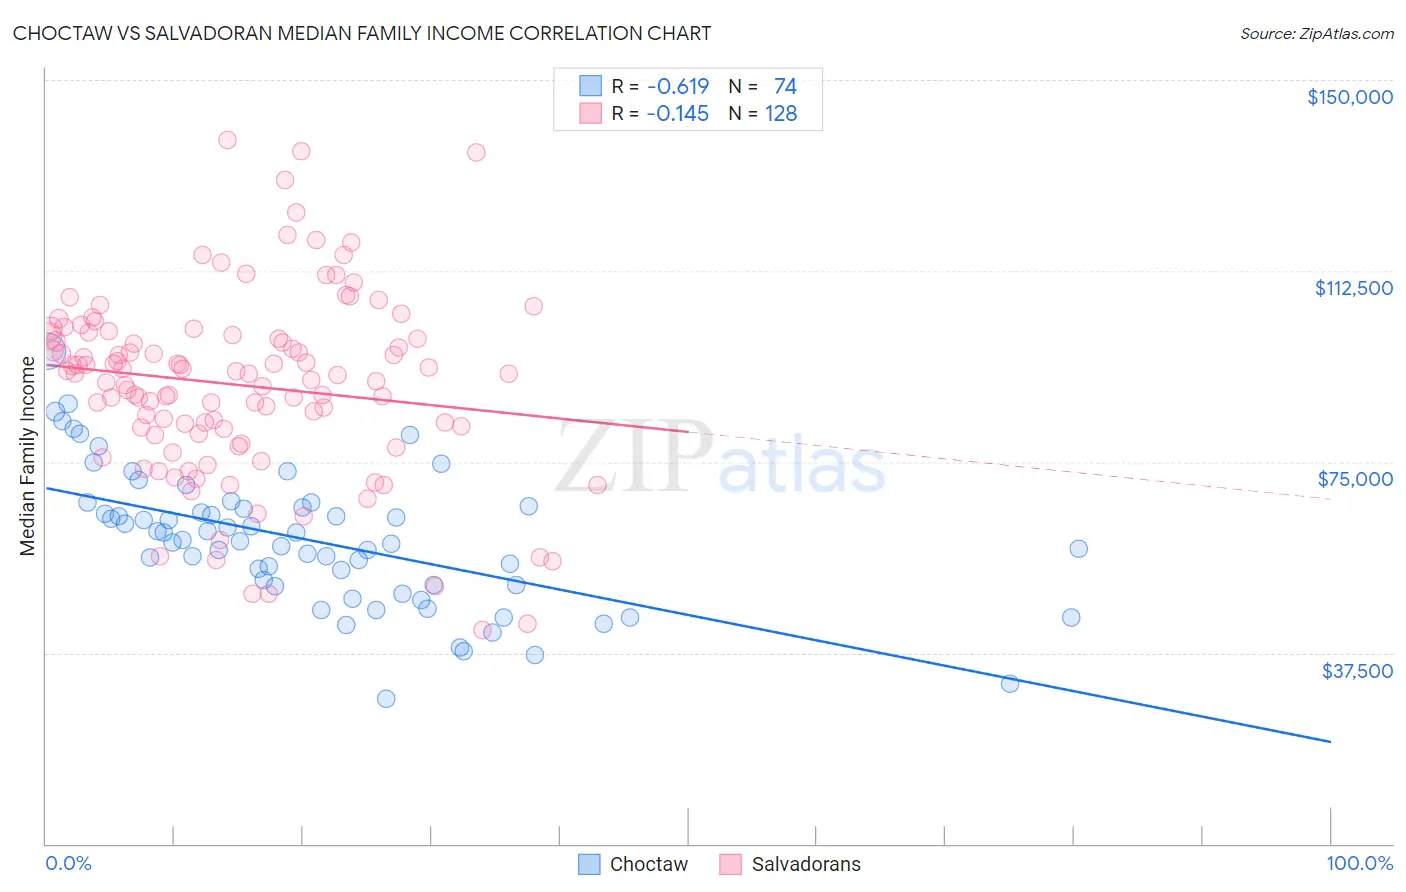
Choctaw vs Salvadoran Median Family Income Correlation Chart
The statistical analysis conducted on geographies consisting of 269,558,288 people shows a significant negative correlation between the proportion of Choctaw and median family income in the United States with a correlation coefficient (R) of -0.619 and weighted average of $84,835. Similarly, the statistical analysis conducted on geographies consisting of 398,577,694 people shows a poor negative correlation between the proportion of Salvadorans and median family income in the United States with a correlation coefficient (R) of -0.145 and weighted average of $94,109, a difference of 10.9%.
Median Family Income Correlation Summary
| Measurement | Choctaw | Salvadoran |
| Minimum | $28,571 | $41,966 |
| Maximum | $96,727 | $138,117 |
| Range | $68,156 | $96,151 |
| Mean | $59,567 | $90,099 |
| Median | $59,584 | $92,329 |
| Interquartile 25% (IQ1) | $50,833 | $81,022 |
| Interquartile 75% (IQ3) | $66,002 | $99,847 |
| Interquartile Range (IQR) | $15,169 | $18,825 |
| Standard Deviation (Sample) | $13,206 | $18,212 |
| Standard Deviation (Population) | $13,117 | $18,141 |
Similar Demographics by Median Family Income
Demographics Similar to Choctaw by Median Family Income
In terms of median family income, the demographic groups most similar to Choctaw are Immigrants from Bahamas ($84,732, a difference of 0.12%), Cuban ($84,981, a difference of 0.17%), Honduran ($85,004, a difference of 0.20%), Immigrants from Central America ($85,050, a difference of 0.25%), and Haitian ($85,218, a difference of 0.45%).
| Demographics | Rating | Rank | Median Family Income |
| Immigrants | Dominica | 0.0 /100 | #306 | Tragic $85,411 |
| Chickasaw | 0.0 /100 | #307 | Tragic $85,356 |
| U.S. Virgin Islanders | 0.0 /100 | #308 | Tragic $85,294 |
| Haitians | 0.0 /100 | #309 | Tragic $85,218 |
| Immigrants | Central America | 0.0 /100 | #310 | Tragic $85,050 |
| Hondurans | 0.0 /100 | #311 | Tragic $85,004 |
| Cubans | 0.0 /100 | #312 | Tragic $84,981 |
| Choctaw | 0.0 /100 | #313 | Tragic $84,835 |
| Immigrants | Bahamas | 0.0 /100 | #314 | Tragic $84,732 |
| Apache | 0.0 /100 | #315 | Tragic $84,451 |
| Immigrants | Haiti | 0.0 /100 | #316 | Tragic $84,018 |
| Yakama | 0.0 /100 | #317 | Tragic $83,932 |
| Immigrants | Mexico | 0.0 /100 | #318 | Tragic $83,639 |
| Immigrants | Honduras | 0.0 /100 | #319 | Tragic $83,618 |
| Seminole | 0.0 /100 | #320 | Tragic $83,354 |
Demographics Similar to Salvadorans by Median Family Income
In terms of median family income, the demographic groups most similar to Salvadorans are Somali ($94,085, a difference of 0.030%), Nepalese ($94,153, a difference of 0.050%), Immigrants from Trinidad and Tobago ($93,988, a difference of 0.13%), Barbadian ($93,919, a difference of 0.20%), and German Russian ($93,858, a difference of 0.27%).
| Demographics | Rating | Rank | Median Family Income |
| Immigrants | Venezuela | 1.9 /100 | #232 | Tragic $94,904 |
| Immigrants | Bangladesh | 1.6 /100 | #233 | Tragic $94,665 |
| Immigrants | Western Africa | 1.6 /100 | #234 | Tragic $94,638 |
| Immigrants | Burma/Myanmar | 1.5 /100 | #235 | Tragic $94,472 |
| Trinidadians and Tobagonians | 1.5 /100 | #236 | Tragic $94,466 |
| Alaskan Athabascans | 1.5 /100 | #237 | Tragic $94,429 |
| Nepalese | 1.3 /100 | #238 | Tragic $94,153 |
| Salvadorans | 1.2 /100 | #239 | Tragic $94,109 |
| Somalis | 1.2 /100 | #240 | Tragic $94,085 |
| Immigrants | Trinidad and Tobago | 1.2 /100 | #241 | Tragic $93,988 |
| Barbadians | 1.1 /100 | #242 | Tragic $93,919 |
| German Russians | 1.1 /100 | #243 | Tragic $93,858 |
| Sub-Saharan Africans | 1.0 /100 | #244 | Tragic $93,748 |
| Immigrants | Middle Africa | 1.0 /100 | #245 | Tragic $93,593 |
| Guyanese | 0.9 /100 | #246 | Tragic $93,373 |