Choctaw vs Immigrants from Guatemala Householder Income Over 65 years
COMPARE
Choctaw
Immigrants from Guatemala
Householder Income Over 65 years
Householder Income Over 65 years Comparison
Choctaw
Immigrants from Guatemala
$53,060
HOUSEHOLDER INCOME OVER 65 YEARS
0.0/ 100
METRIC RATING
303rd/ 347
METRIC RANK
$53,950
HOUSEHOLDER INCOME OVER 65 YEARS
0.1/ 100
METRIC RATING
284th/ 347
METRIC RANK
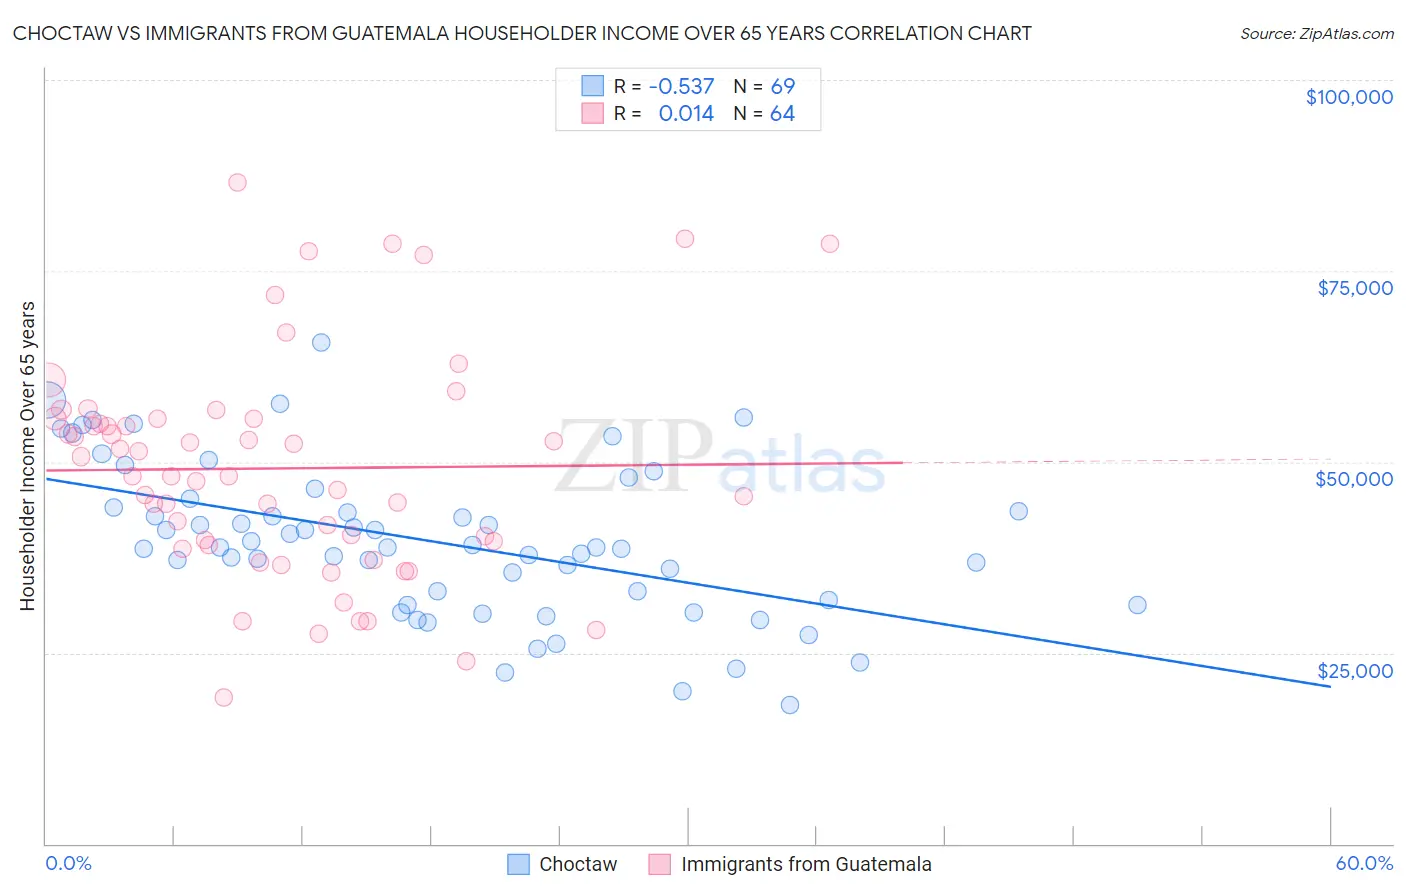
Choctaw vs Immigrants from Guatemala Householder Income Over 65 years Correlation Chart
The statistical analysis conducted on geographies consisting of 268,776,523 people shows a substantial negative correlation between the proportion of Choctaw and household income with householder over the age of 65 in the United States with a correlation coefficient (R) of -0.537 and weighted average of $53,060. Similarly, the statistical analysis conducted on geographies consisting of 376,354,988 people shows no correlation between the proportion of Immigrants from Guatemala and household income with householder over the age of 65 in the United States with a correlation coefficient (R) of 0.014 and weighted average of $53,950, a difference of 1.7%.
Householder Income Over 65 years Correlation Summary
| Measurement | Choctaw | Immigrants from Guatemala |
| Minimum | $18,125 | $19,196 |
| Maximum | $65,690 | $86,499 |
| Range | $47,565 | $67,303 |
| Mean | $39,539 | $49,149 |
| Median | $38,767 | $48,160 |
| Interquartile 25% (IQ1) | $31,582 | $39,399 |
| Interquartile 75% (IQ3) | $44,543 | $55,646 |
| Interquartile Range (IQR) | $12,961 | $16,247 |
| Standard Deviation (Sample) | $10,045 | $14,455 |
| Standard Deviation (Population) | $9,972 | $14,342 |
Demographics Similar to Choctaw and Immigrants from Guatemala by Householder Income Over 65 years
In terms of householder income over 65 years, the demographic groups most similar to Choctaw are Spanish American Indian ($53,077, a difference of 0.030%), Yuman ($53,110, a difference of 0.090%), Immigrants from Bahamas ($53,174, a difference of 0.21%), Ottawa ($53,217, a difference of 0.30%), and Central American Indian ($53,232, a difference of 0.32%). Similarly, the demographic groups most similar to Immigrants from Guatemala are Immigrants from Liberia ($53,967, a difference of 0.030%), Mexican ($53,897, a difference of 0.10%), Chippewa ($53,847, a difference of 0.19%), Immigrants from Barbados ($53,766, a difference of 0.34%), and Paiute ($53,762, a difference of 0.35%).
| Demographics | Rating | Rank | Householder Income Over 65 years |
| Immigrants | Liberia | 0.1 /100 | #283 | Tragic $53,967 |
| Immigrants | Guatemala | 0.1 /100 | #284 | Tragic $53,950 |
| Mexicans | 0.1 /100 | #285 | Tragic $53,897 |
| Chippewa | 0.1 /100 | #286 | Tragic $53,847 |
| Immigrants | Barbados | 0.1 /100 | #287 | Tragic $53,766 |
| Paiute | 0.1 /100 | #288 | Tragic $53,762 |
| Iroquois | 0.1 /100 | #289 | Tragic $53,737 |
| Chickasaw | 0.1 /100 | #290 | Tragic $53,732 |
| Africans | 0.0 /100 | #291 | Tragic $53,711 |
| Shoshone | 0.0 /100 | #292 | Tragic $53,681 |
| Immigrants | Belize | 0.0 /100 | #293 | Tragic $53,665 |
| Senegalese | 0.0 /100 | #294 | Tragic $53,591 |
| Immigrants | Central America | 0.0 /100 | #295 | Tragic $53,420 |
| Immigrants | Somalia | 0.0 /100 | #296 | Tragic $53,333 |
| Immigrants | Latin America | 0.0 /100 | #297 | Tragic $53,265 |
| Central American Indians | 0.0 /100 | #298 | Tragic $53,232 |
| Ottawa | 0.0 /100 | #299 | Tragic $53,217 |
| Immigrants | Bahamas | 0.0 /100 | #300 | Tragic $53,174 |
| Yuman | 0.0 /100 | #301 | Tragic $53,110 |
| Spanish American Indians | 0.0 /100 | #302 | Tragic $53,077 |
| Choctaw | 0.0 /100 | #303 | Tragic $53,060 |