Choctaw vs Seminole Median Family Income
COMPARE
Choctaw
Seminole
Median Family Income
Median Family Income Comparison
Choctaw
Seminole
$84,835
MEDIAN FAMILY INCOME
0.0/ 100
METRIC RATING
313th/ 347
METRIC RANK
$83,354
MEDIAN FAMILY INCOME
0.0/ 100
METRIC RATING
320th/ 347
METRIC RANK
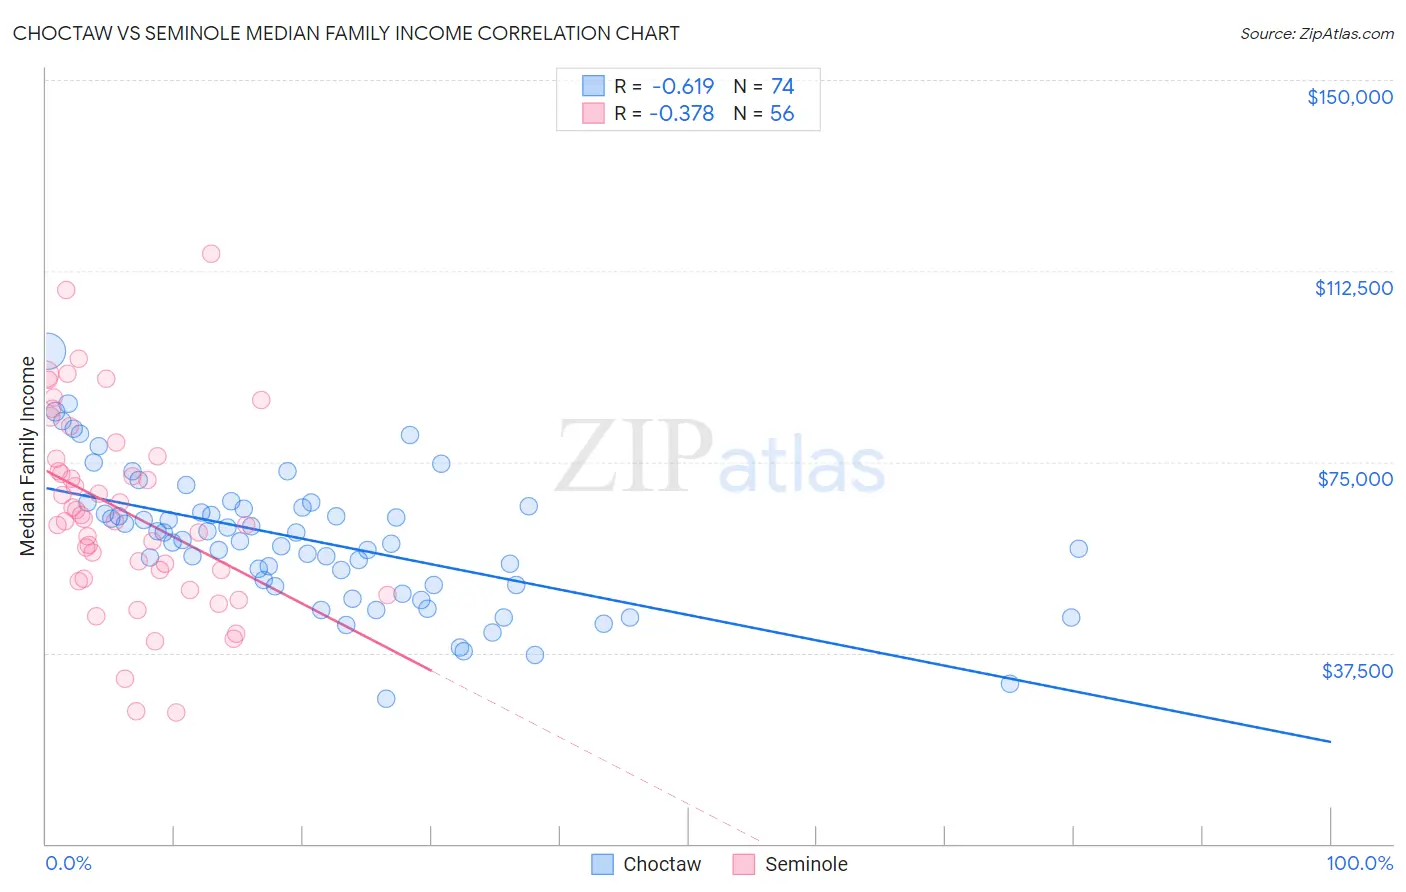
Choctaw vs Seminole Median Family Income Correlation Chart
The statistical analysis conducted on geographies consisting of 269,558,288 people shows a significant negative correlation between the proportion of Choctaw and median family income in the United States with a correlation coefficient (R) of -0.619 and weighted average of $84,835. Similarly, the statistical analysis conducted on geographies consisting of 118,293,158 people shows a mild negative correlation between the proportion of Seminole and median family income in the United States with a correlation coefficient (R) of -0.378 and weighted average of $83,354, a difference of 1.8%.
Median Family Income Correlation Summary
| Measurement | Choctaw | Seminole |
| Minimum | $28,571 | $25,806 |
| Maximum | $96,727 | $115,976 |
| Range | $68,156 | $90,170 |
| Mean | $59,567 | $65,304 |
| Median | $59,584 | $63,647 |
| Interquartile 25% (IQ1) | $50,833 | $52,915 |
| Interquartile 75% (IQ3) | $66,002 | $75,846 |
| Interquartile Range (IQR) | $15,169 | $22,930 |
| Standard Deviation (Sample) | $13,206 | $19,025 |
| Standard Deviation (Population) | $13,117 | $18,855 |
Demographics Similar to Choctaw and Seminole by Median Family Income
In terms of median family income, the demographic groups most similar to Choctaw are Immigrants from Bahamas ($84,732, a difference of 0.12%), Cuban ($84,981, a difference of 0.17%), Honduran ($85,004, a difference of 0.20%), Immigrants from Central America ($85,050, a difference of 0.25%), and Haitian ($85,218, a difference of 0.45%). Similarly, the demographic groups most similar to Seminole are Immigrants from Caribbean ($83,319, a difference of 0.040%), Immigrants from Honduras ($83,618, a difference of 0.32%), Immigrants from Mexico ($83,639, a difference of 0.34%), Dominican ($82,888, a difference of 0.56%), and Yakama ($83,932, a difference of 0.69%).
| Demographics | Rating | Rank | Median Family Income |
| Immigrants | Dominica | 0.0 /100 | #306 | Tragic $85,411 |
| Chickasaw | 0.0 /100 | #307 | Tragic $85,356 |
| U.S. Virgin Islanders | 0.0 /100 | #308 | Tragic $85,294 |
| Haitians | 0.0 /100 | #309 | Tragic $85,218 |
| Immigrants | Central America | 0.0 /100 | #310 | Tragic $85,050 |
| Hondurans | 0.0 /100 | #311 | Tragic $85,004 |
| Cubans | 0.0 /100 | #312 | Tragic $84,981 |
| Choctaw | 0.0 /100 | #313 | Tragic $84,835 |
| Immigrants | Bahamas | 0.0 /100 | #314 | Tragic $84,732 |
| Apache | 0.0 /100 | #315 | Tragic $84,451 |
| Immigrants | Haiti | 0.0 /100 | #316 | Tragic $84,018 |
| Yakama | 0.0 /100 | #317 | Tragic $83,932 |
| Immigrants | Mexico | 0.0 /100 | #318 | Tragic $83,639 |
| Immigrants | Honduras | 0.0 /100 | #319 | Tragic $83,618 |
| Seminole | 0.0 /100 | #320 | Tragic $83,354 |
| Immigrants | Caribbean | 0.0 /100 | #321 | Tragic $83,319 |
| Dominicans | 0.0 /100 | #322 | Tragic $82,888 |
| Bahamians | 0.0 /100 | #323 | Tragic $82,631 |
| Creek | 0.0 /100 | #324 | Tragic $82,560 |
| Sioux | 0.0 /100 | #325 | Tragic $82,386 |
| Immigrants | Congo | 0.0 /100 | #326 | Tragic $82,216 |