Choctaw vs Slovene Median Household Income
COMPARE
Choctaw
Slovene
Median Household Income
Median Household Income Comparison
Choctaw
Slovenes
$69,947
MEDIAN HOUSEHOLD INCOME
0.0/ 100
METRIC RATING
322nd/ 347
METRIC RANK
$85,562
MEDIAN HOUSEHOLD INCOME
57.4/ 100
METRIC RATING
172nd/ 347
METRIC RANK
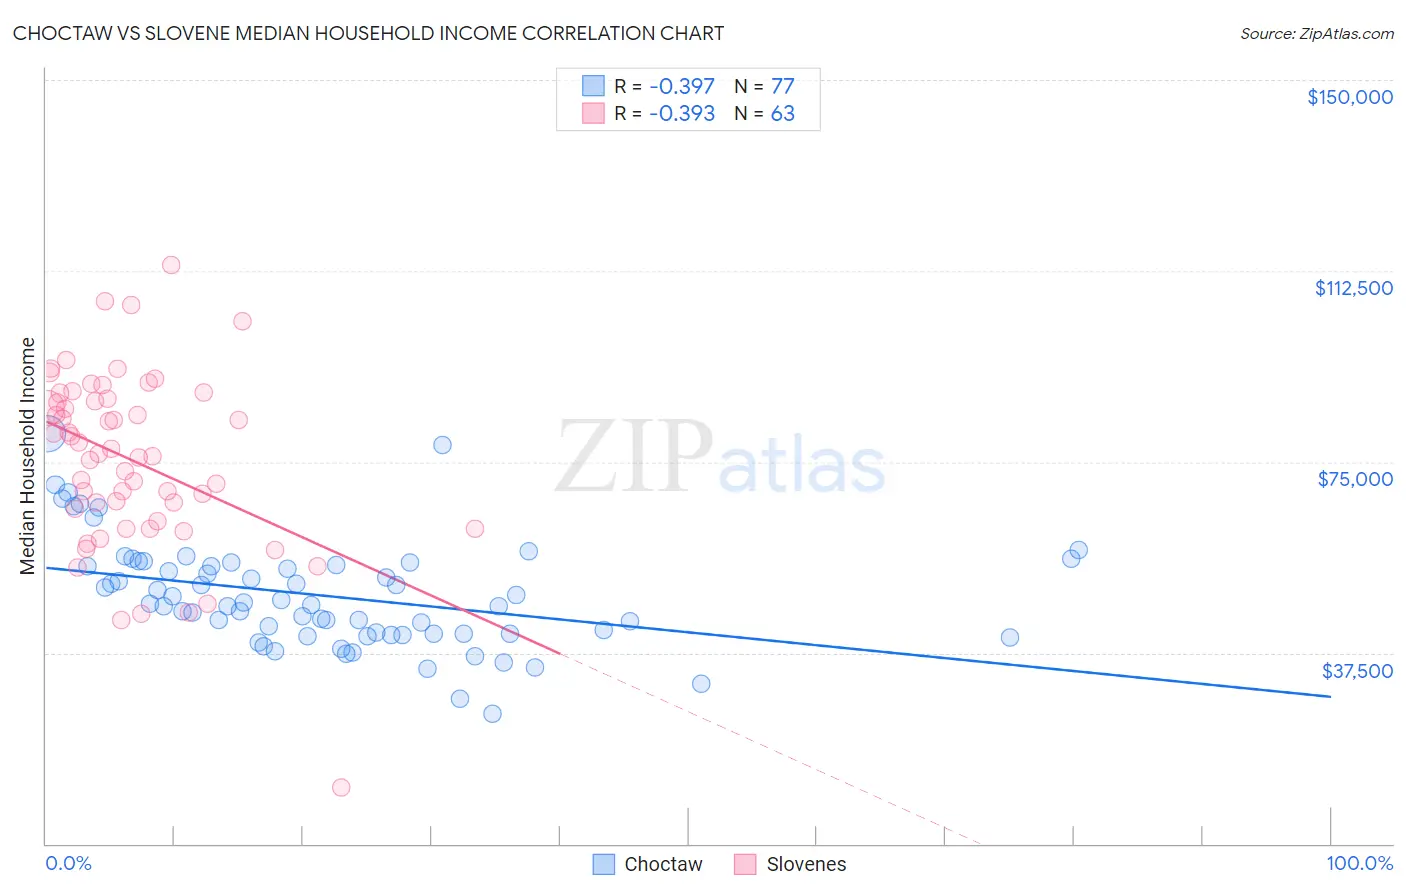
Choctaw vs Slovene Median Household Income Correlation Chart
The statistical analysis conducted on geographies consisting of 269,579,280 people shows a mild negative correlation between the proportion of Choctaw and median household income in the United States with a correlation coefficient (R) of -0.397 and weighted average of $69,947. Similarly, the statistical analysis conducted on geographies consisting of 261,226,883 people shows a mild negative correlation between the proportion of Slovenes and median household income in the United States with a correlation coefficient (R) of -0.393 and weighted average of $85,562, a difference of 22.3%.
Median Household Income Correlation Summary
| Measurement | Choctaw | Slovene |
| Minimum | $25,625 | $11,161 |
| Maximum | $80,457 | $113,650 |
| Range | $54,832 | $102,489 |
| Mean | $48,786 | $75,280 |
| Median | $47,101 | $76,693 |
| Interquartile 25% (IQ1) | $41,215 | $63,438 |
| Interquartile 75% (IQ3) | $54,919 | $87,449 |
| Interquartile Range (IQR) | $13,705 | $24,011 |
| Standard Deviation (Sample) | $10,591 | $17,550 |
| Standard Deviation (Population) | $10,522 | $17,410 |
Similar Demographics by Median Household Income
Demographics Similar to Choctaw by Median Household Income
In terms of median household income, the demographic groups most similar to Choctaw are Chickasaw ($70,005, a difference of 0.080%), Colville ($70,094, a difference of 0.21%), Bahamian ($69,726, a difference of 0.32%), Yup'ik ($69,695, a difference of 0.36%), and Immigrants from Dominican Republic ($70,208, a difference of 0.37%).
| Demographics | Rating | Rank | Median Household Income |
| Ottawa | 0.0 /100 | #315 | Tragic $70,984 |
| Apache | 0.0 /100 | #316 | Tragic $70,927 |
| Cajuns | 0.0 /100 | #317 | Tragic $70,605 |
| Chippewa | 0.0 /100 | #318 | Tragic $70,539 |
| Immigrants | Dominican Republic | 0.0 /100 | #319 | Tragic $70,208 |
| Colville | 0.0 /100 | #320 | Tragic $70,094 |
| Chickasaw | 0.0 /100 | #321 | Tragic $70,005 |
| Choctaw | 0.0 /100 | #322 | Tragic $69,947 |
| Bahamians | 0.0 /100 | #323 | Tragic $69,726 |
| Yup'ik | 0.0 /100 | #324 | Tragic $69,695 |
| Seminole | 0.0 /100 | #325 | Tragic $69,420 |
| Yuman | 0.0 /100 | #326 | Tragic $68,743 |
| Immigrants | Cuba | 0.0 /100 | #327 | Tragic $68,461 |
| Menominee | 0.0 /100 | #328 | Tragic $68,423 |
| Dutch West Indians | 0.0 /100 | #329 | Tragic $68,412 |
Demographics Similar to Slovenes by Median Household Income
In terms of median household income, the demographic groups most similar to Slovenes are Immigrants from South America ($85,611, a difference of 0.060%), Swiss ($85,681, a difference of 0.14%), Colombian ($85,716, a difference of 0.18%), Icelander ($85,797, a difference of 0.27%), and Immigrants from Cameroon ($85,314, a difference of 0.29%).
| Demographics | Rating | Rank | Median Household Income |
| Norwegians | 65.3 /100 | #165 | Good $86,084 |
| Scandinavians | 65.1 /100 | #166 | Good $86,073 |
| Immigrants | Immigrants | 61.3 /100 | #167 | Good $85,818 |
| Icelanders | 61.0 /100 | #168 | Good $85,797 |
| Colombians | 59.7 /100 | #169 | Average $85,716 |
| Swiss | 59.2 /100 | #170 | Average $85,681 |
| Immigrants | South America | 58.1 /100 | #171 | Average $85,611 |
| Slovenes | 57.4 /100 | #172 | Average $85,562 |
| Immigrants | Cameroon | 53.4 /100 | #173 | Average $85,314 |
| Scottish | 50.0 /100 | #174 | Average $85,101 |
| Immigrants | Costa Rica | 49.2 /100 | #175 | Average $85,054 |
| Alsatians | 49.2 /100 | #176 | Average $85,053 |
| Immigrants | Eritrea | 48.8 /100 | #177 | Average $85,025 |
| Czechoslovakians | 47.8 /100 | #178 | Average $84,965 |
| English | 47.0 /100 | #179 | Average $84,915 |