Choctaw vs Immigrants from Argentina Child Poverty Under the Age of 16
COMPARE
Choctaw
Immigrants from Argentina
Child Poverty Under the Age of 16
Child Poverty Under the Age of 16 Comparison
Choctaw
Immigrants from Argentina
21.0%
CHILD POVERTY UNDER THE AGE OF 16
0.0/ 100
METRIC RATING
303rd/ 347
METRIC RANK
14.5%
CHILD POVERTY UNDER THE AGE OF 16
97.1/ 100
METRIC RATING
86th/ 347
METRIC RANK
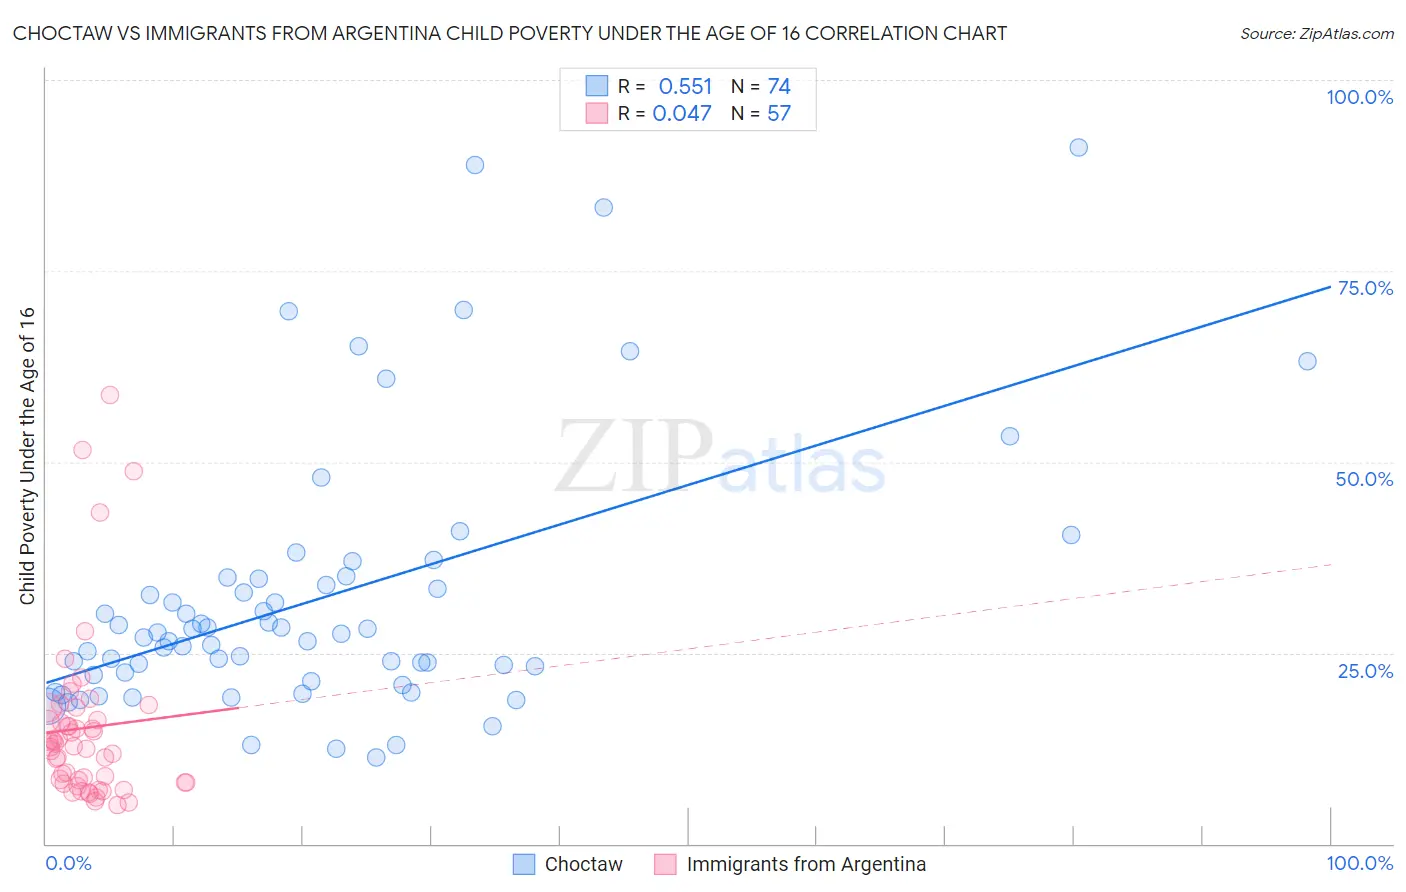
Choctaw vs Immigrants from Argentina Child Poverty Under the Age of 16 Correlation Chart
The statistical analysis conducted on geographies consisting of 268,590,818 people shows a substantial positive correlation between the proportion of Choctaw and poverty level among children under the age of 16 in the United States with a correlation coefficient (R) of 0.551 and weighted average of 21.0%. Similarly, the statistical analysis conducted on geographies consisting of 262,825,580 people shows no correlation between the proportion of Immigrants from Argentina and poverty level among children under the age of 16 in the United States with a correlation coefficient (R) of 0.047 and weighted average of 14.5%, a difference of 45.0%.
Child Poverty Under the Age of 16 Correlation Summary
| Measurement | Choctaw | Immigrants from Argentina |
| Minimum | 11.4% | 5.1% |
| Maximum | 91.2% | 58.8% |
| Range | 79.9% | 53.7% |
| Mean | 32.2% | 15.2% |
| Median | 27.2% | 12.8% |
| Interquartile 25% (IQ1) | 22.1% | 8.0% |
| Interquartile 75% (IQ3) | 34.7% | 17.0% |
| Interquartile Range (IQR) | 12.6% | 9.0% |
| Standard Deviation (Sample) | 17.5% | 11.1% |
| Standard Deviation (Population) | 17.4% | 11.0% |
Similar Demographics by Child Poverty Under the Age of 16
Demographics Similar to Choctaw by Child Poverty Under the Age of 16
In terms of child poverty under the age of 16, the demographic groups most similar to Choctaw are Immigrants from Bahamas (21.0%, a difference of 0.040%), Somali (21.0%, a difference of 0.050%), Immigrants from Grenada (21.0%, a difference of 0.28%), Indonesian (21.0%, a difference of 0.32%), and Seminole (21.1%, a difference of 0.52%).
| Demographics | Rating | Rank | Child Poverty Under the Age of 16 |
| Immigrants | Caribbean | 0.0 /100 | #296 | Tragic 20.8% |
| Hispanics or Latinos | 0.0 /100 | #297 | Tragic 20.8% |
| Arapaho | 0.0 /100 | #298 | Tragic 20.8% |
| Immigrants | Haiti | 0.0 /100 | #299 | Tragic 20.9% |
| Indonesians | 0.0 /100 | #300 | Tragic 21.0% |
| Immigrants | Grenada | 0.0 /100 | #301 | Tragic 21.0% |
| Immigrants | Bahamas | 0.0 /100 | #302 | Tragic 21.0% |
| Choctaw | 0.0 /100 | #303 | Tragic 21.0% |
| Somalis | 0.0 /100 | #304 | Tragic 21.0% |
| Seminole | 0.0 /100 | #305 | Tragic 21.1% |
| Guatemalans | 0.0 /100 | #306 | Tragic 21.2% |
| Immigrants | Central America | 0.0 /100 | #307 | Tragic 21.3% |
| British West Indians | 0.0 /100 | #308 | Tragic 21.3% |
| Immigrants | Mexico | 0.0 /100 | #309 | Tragic 21.5% |
| Bahamians | 0.0 /100 | #310 | Tragic 21.5% |
Demographics Similar to Immigrants from Argentina by Child Poverty Under the Age of 16
In terms of child poverty under the age of 16, the demographic groups most similar to Immigrants from Argentina are Taiwanese (14.5%, a difference of 0.0%), Soviet Union (14.5%, a difference of 0.080%), Immigrants from Latvia (14.5%, a difference of 0.10%), Northern European (14.5%, a difference of 0.10%), and Egyptian (14.5%, a difference of 0.12%).
| Demographics | Rating | Rank | Child Poverty Under the Age of 16 |
| Swiss | 97.3 /100 | #79 | Exceptional 14.5% |
| Immigrants | North Macedonia | 97.2 /100 | #80 | Exceptional 14.5% |
| Finns | 97.2 /100 | #81 | Exceptional 14.5% |
| Immigrants | Canada | 97.2 /100 | #82 | Exceptional 14.5% |
| Egyptians | 97.2 /100 | #83 | Exceptional 14.5% |
| Immigrants | Latvia | 97.1 /100 | #84 | Exceptional 14.5% |
| Soviet Union | 97.1 /100 | #85 | Exceptional 14.5% |
| Immigrants | Argentina | 97.1 /100 | #86 | Exceptional 14.5% |
| Taiwanese | 97.1 /100 | #87 | Exceptional 14.5% |
| Northern Europeans | 97.0 /100 | #88 | Exceptional 14.5% |
| Germans | 96.9 /100 | #89 | Exceptional 14.5% |
| Austrians | 96.9 /100 | #90 | Exceptional 14.5% |
| Immigrants | North America | 96.7 /100 | #91 | Exceptional 14.6% |
| Immigrants | Italy | 96.7 /100 | #92 | Exceptional 14.6% |
| Argentineans | 96.6 /100 | #93 | Exceptional 14.6% |